Day 1 of the #30DayMapChallenge 2026.
Points — A map challenge classic. Map with points.
What better way to start a month of maps than with coffee? Sydney takes its cafes seriously, so for the first theme I mapped every cafe in Greater Sydney with MapAI.
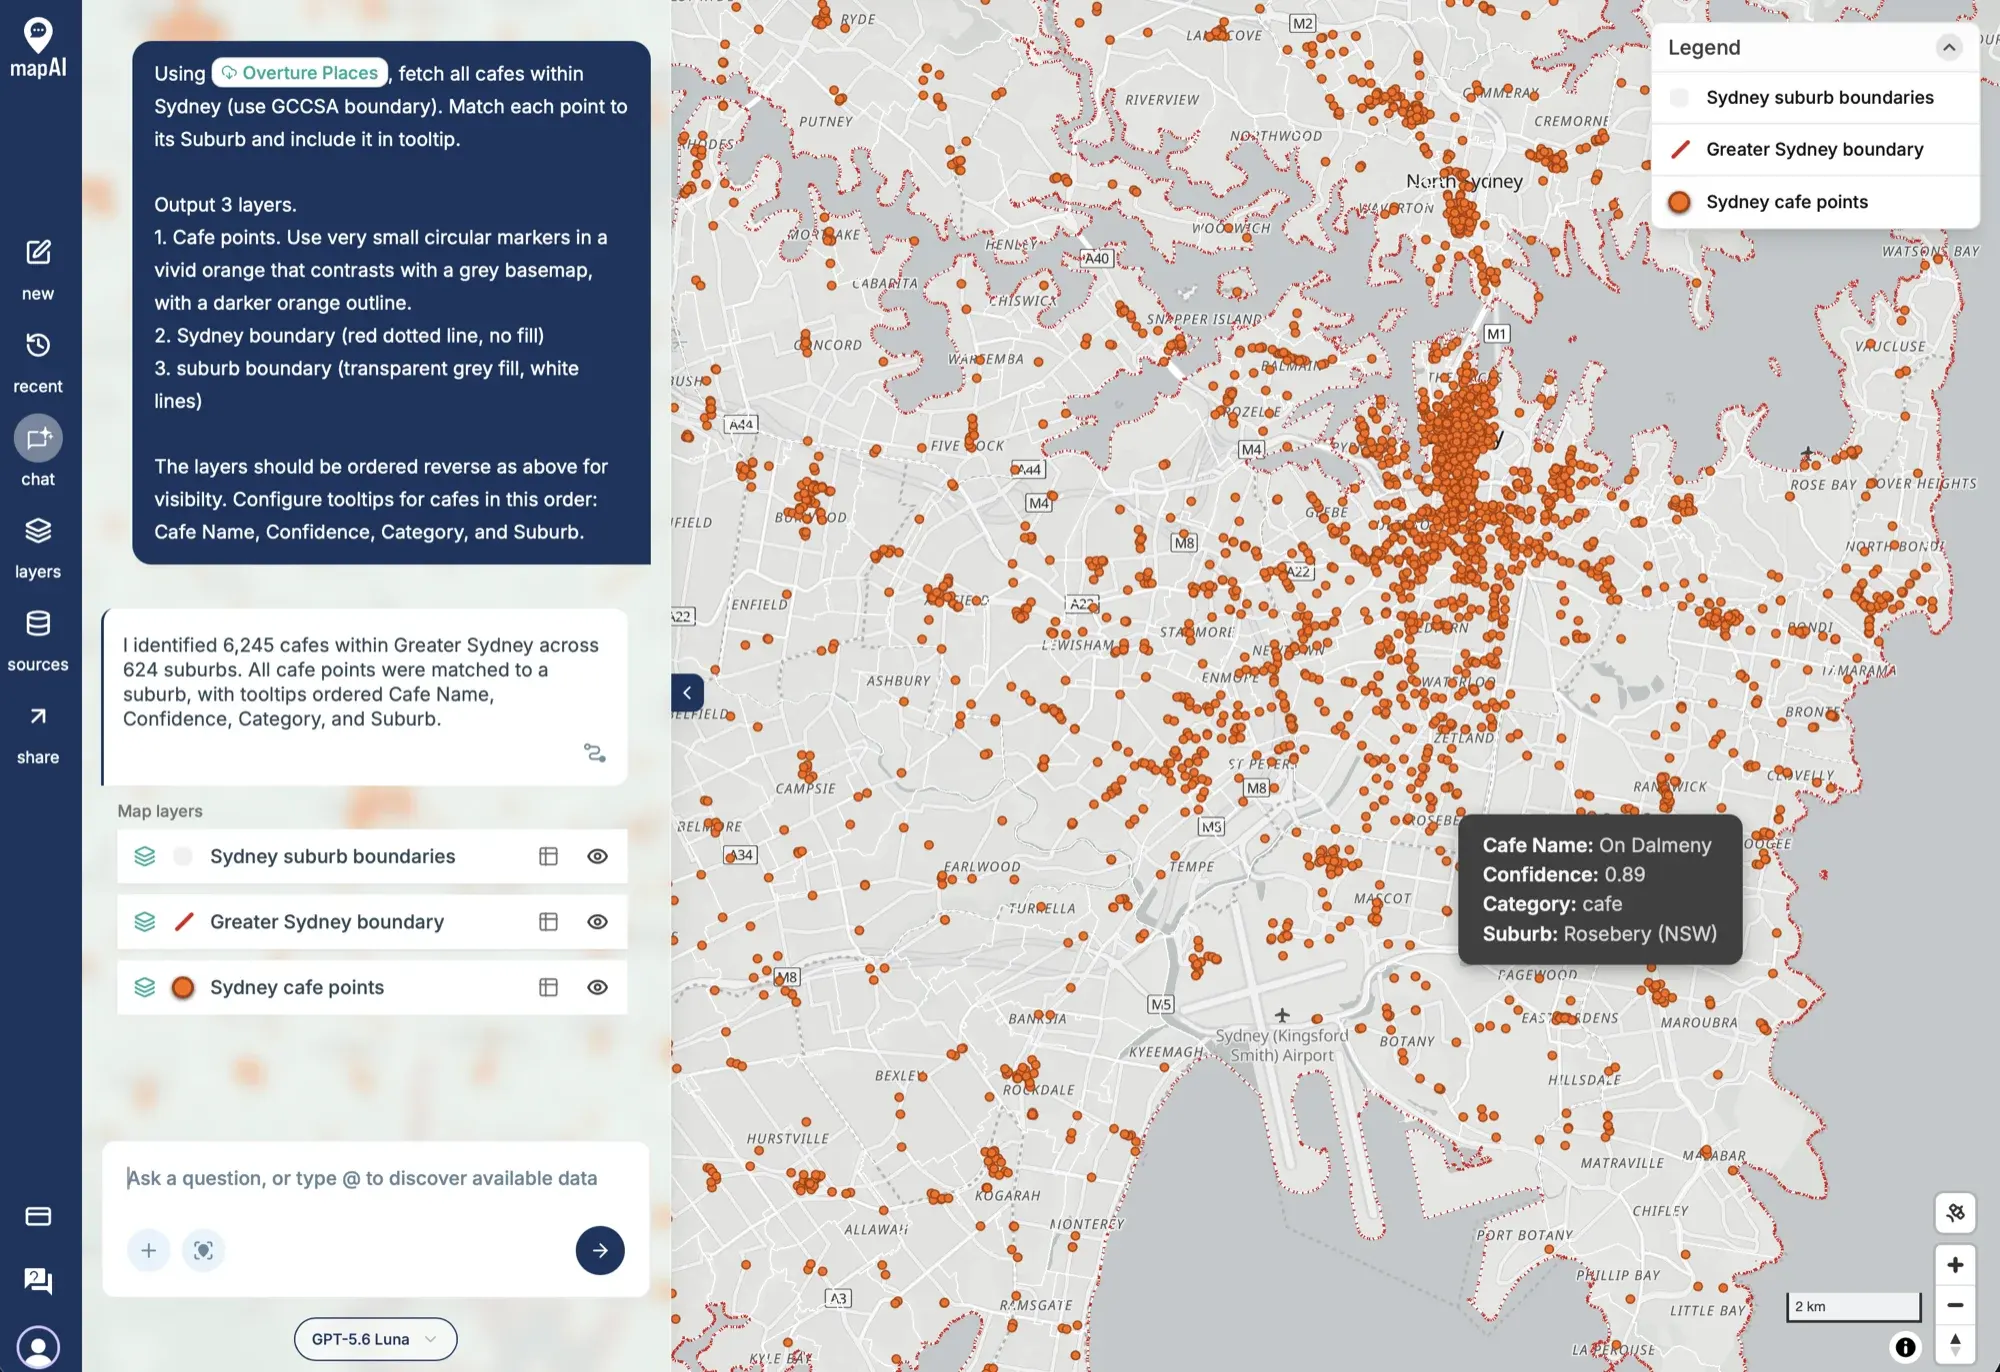
The prompt
This was the whole thing, in one go:
Using Overture Places, fetch all cafes within Sydney (use GCCSA boundary). Match each point to its Suburb and include it in tooltip.
Output 3 layers.
- Cafe points. Use very small circular markers in a vivid orange that contrasts with a grey basemap, with a darker orange outline.
- Sydney boundary (red dotted line, no fill)
- suburb boundary (transparent grey fill, white lines)
The layers should be ordered reverse as above for visibility. Configure tooltips for cafes in this order: Cafe Name, Confidence, Category, and Suburb.
What MapAI did
By the numbers, this map took:
- About 25 turns of the agent working through the problem
- About 3 minutes 15 seconds from prompt to finished map
- About 58 credits
Every answer in MapAI comes with an evidence trail, so here is what it says it did, in its own words where possible.
How it understood the question
- Source: cafes from Overture Places.
- Geography: “Sydney” interpreted as the 2021 Greater Sydney GCCSA from the ABS.
- Category: both Overture’s cafe and coffee shop categories counted as cafes.
- Assumption: each cafe belongs to the suburb polygon that covers its location.
- Output: three layers, ordered suburb boundaries, Sydney boundary, then cafe points.
The workflow
- Inspected the Overture Places fields and category mappings.
- Fetched 6,272 cafe and coffee shop points across a bounding box around Sydney.
- Kept the 6,245 points that fall inside the Greater Sydney GCCSA boundary.
- Matched every one of them to a suburb.
- Saved three styled layers in the reverse of the order I listed them, so the cafes sit on top.
Behind those five steps, the trace shows two rounds of data searches, two data ingests, 13 SQL queries on the PostGIS engine and four saved queries.
The data
- Overture Places for the cafes.
- ABS Data API for the Greater Sydney GCCSA boundary.
- MapAI’s boundaries library for the suburbs.
The SQL
This is the query behind the cafe layer. It keeps cafes covered by the Greater Sydney boundary and looks up the suburb covering each one, after projecting the point into GDA2020 Australian Albers (EPSG:7845) to match the suburb boundaries:
SELECT
  c.primary_name AS cafe_name,
  c.confidence,
  c.primary_category AS category,
  s.name AS suburb,
  c.geometry
FROM
  user_data.sydney_cafes_2ea17eac c
  JOIN user_data.sydney_gccsa_boundary_4b72eba0 g ON g.gccsa_name_2021 = 'Greater Sydney'
  AND ST_Covers (g.geometry, c.geometry)
  LEFT JOIN core.boundaries s ON s.type = 'suburb'
  AND ST_Covers (s.geometry, ST_Transform (c.geometry, 7845))
ORDER BY
  c.primary_name NULLS LAST,
  c.id
The suburb layer uses a similar trick: a suburb is included if a point guaranteed to sit on its surface (ST_PointOnSurface) falls inside Greater Sydney.
Gaps and uncertainties
MapAI flagged two:
- 27 points fell outside Greater Sydney and were excluded. They were in the bounding box but not in the boundary.
- Overture confidence values are source-provided scores, not validation probabilities.
The result: 6,245 cafes across 624 suburbs, with every point matched to a suburb.
You can explore the live map here: 01 Points - Cafes Sydney.
What I noticed
Sydney’s cafe culture is insane, and the map shows it. Over six thousand cafes, spread across 624 suburbs. I knew this city loves its coffee, but it is something else to see it all on a map.
The confidence score in the tooltip is worth keeping an eye on. Overture Places is built from several sources, and each place carries a confidence value. On this map they range from about 0.58 to over 0.99. As MapAI itself pointed out, that is the source’s own score, not a probability that the cafe is really there. Showing it alongside the name is a quick reminder that a point on a map is a claim about the world, not a fact.
Day 1 done. Tomorrow: lines.
#30DayMapChallenge #mapai #madewithmapai