Day 2 of the #30DayMapChallenge 2026.
Lines — A map challenge classic. Map with lines.
Few things make better lines on a map than railways. So for Day 2 I asked MapAI to draw the rail network of Greater Sydney, and then to do the same for London.
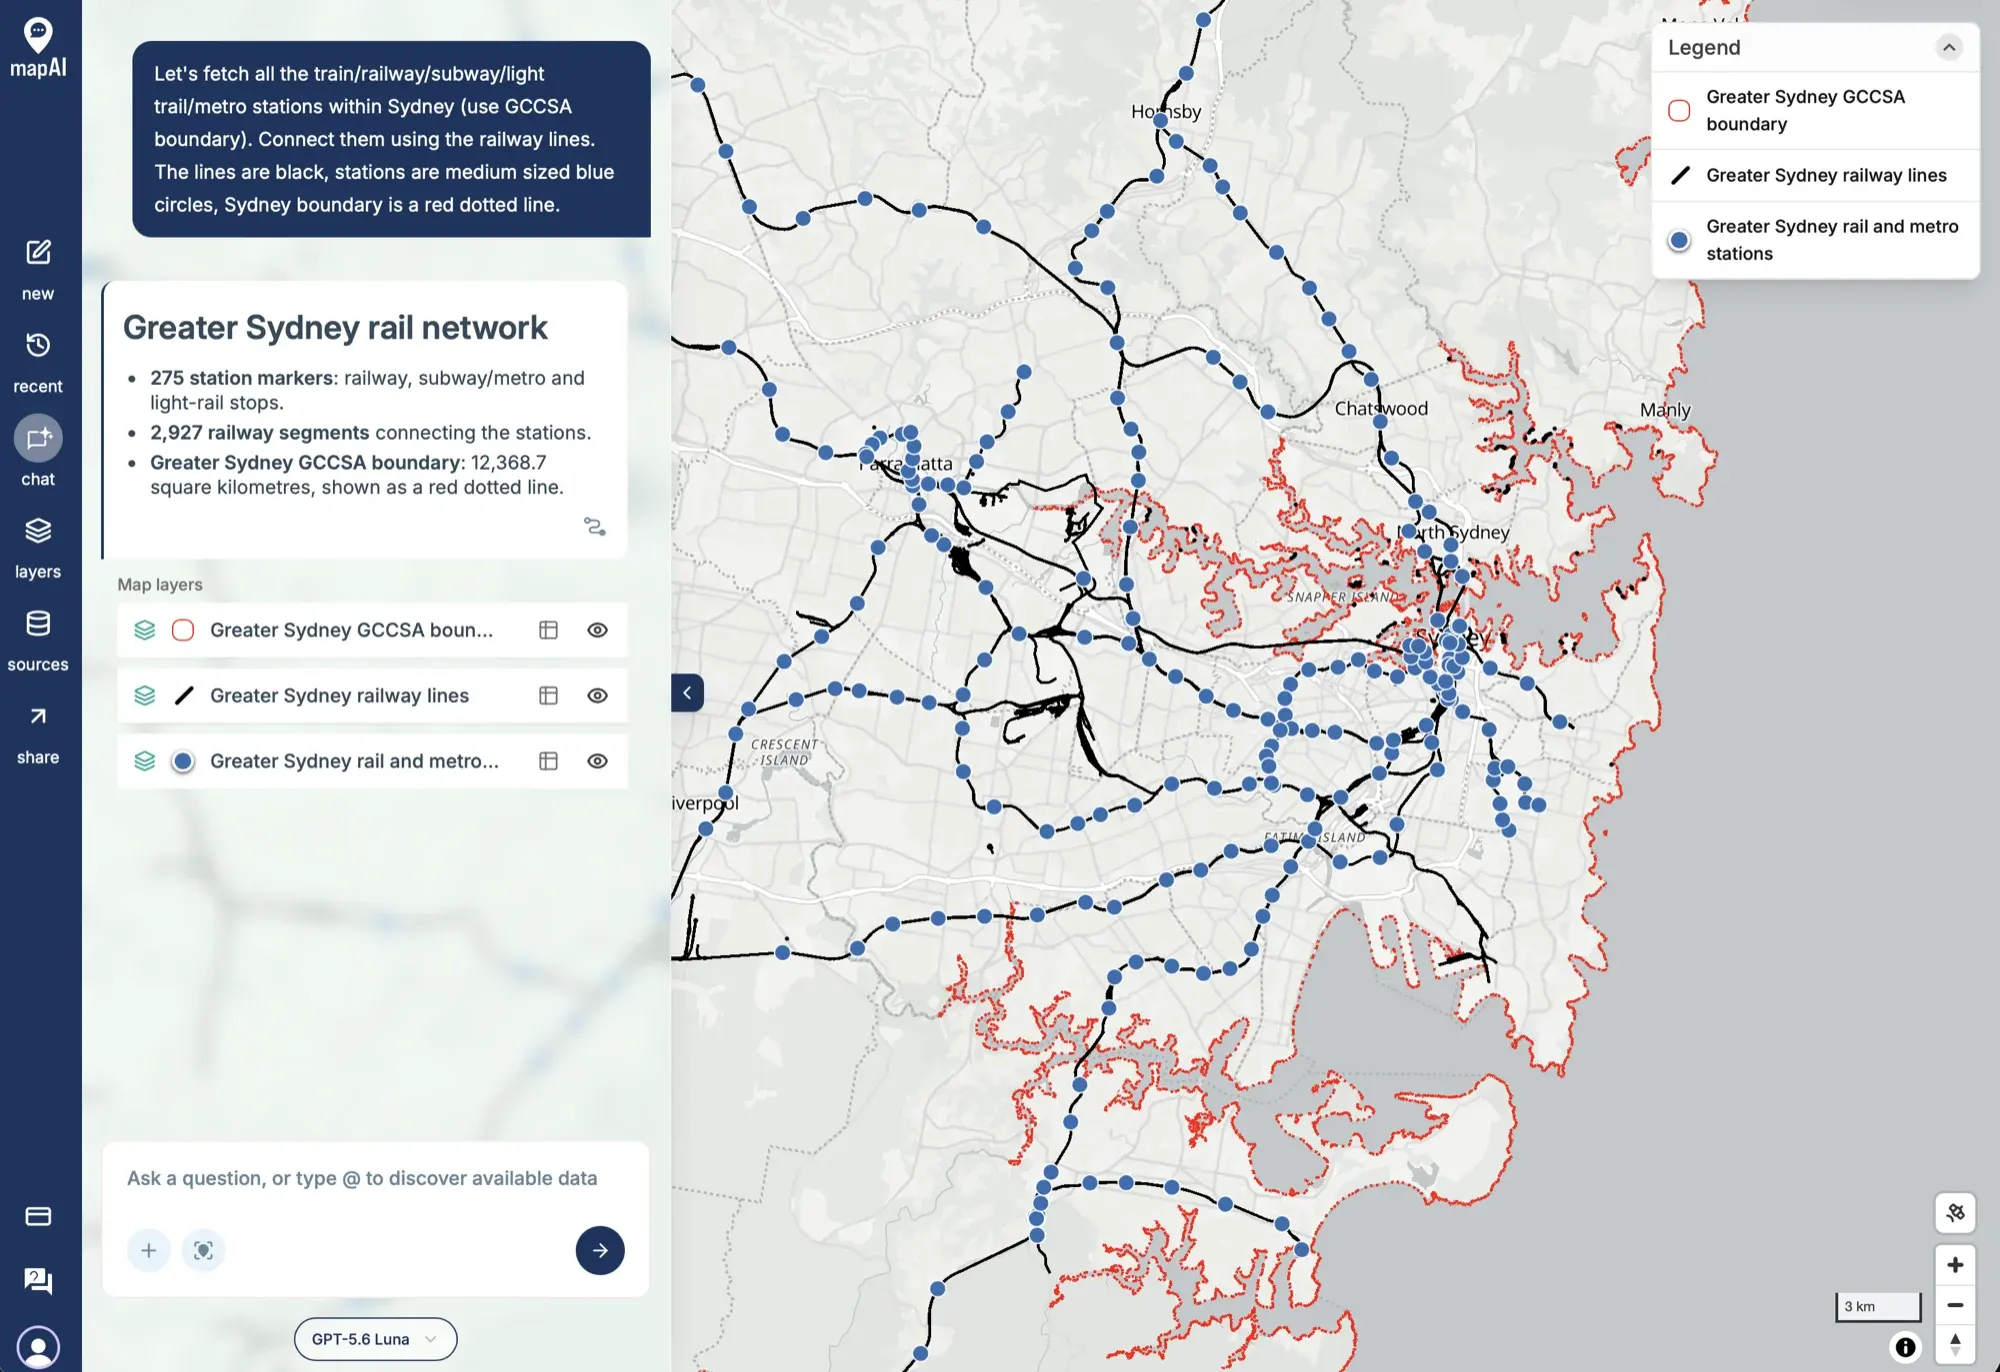
The prompt
Let’s fetch all the train/railway/subway/light trail/metro stations within Sydney (use GCCSA boundary). Connect them using the railway lines. The lines are black, stations are medium sized blue circles, Sydney boundary is a red dotted line.
Yes, I typed “light trail” instead of “light rail”. MapAI worked out what I meant anyway.
What MapAI did
By the numbers, the Sydney map took:
- 38 tool calls
- About 5 minutes (308 seconds) from prompt to finished map
Here is its evidence trail, in its own words where possible.
How it understood the question
- Source: stations and railway lines from Overture Maps, and the boundary from the ABS’s 2021 Australian Statistical Geography Standard.
- Geography: “Sydney” interpreted as the Greater Sydney GCCSA (code 1GSYD).
- Category: metro stations represented by Overture’s subway station features.
- Assumption: “light trail” interpreted as light rail.
- Output: three styled layers, for the boundary, the railway lines and the station markers.
The workflow
- Fetched the 2021 Greater Sydney GCCSA boundary from the Australian Bureau of Statistics.
- Fetched Overture railway stations, subway stations and light-rail stops within a bounding box around Sydney.
- Fetched Overture railway segments within the same bounding box.
- Kept the 275 stations covered by the GCCSA and the 2,927 railway segments that intersect it.
- Converted any station that was not a point into a representative point, and saved three styled layers.
The data
- ABS Data API for the Greater Sydney GCCSA boundary (12,368.7 square kilometres).
- Overture Transportation for the railway lines.
- Overture Infrastructure for the stations and light-rail stops.
The SQL
This is the query behind the station layer.
It takes the railway and subway stations covered by Greater Sydney, appends the light-rail stops, and uses ST_PointOnSurface so that stations mapped as areas still come out as a single dot:
WITH
  sydney AS (
    SELECT
      geometry
    FROM
      user_data.ingest_xsxypfvumiaw_abs_data_api_2d88f9f5
    WHERE
      gccsa_code_2021 = '1GSYD'
  )
SELECT
  s.primary_name AS station_name,
  s.class AS station_type,
  ST_PointOnSurface (s.geometry) AS geometry
FROM
  user_data.ingest_xsxypfvumiaw_frastructure_1a56fc41 s,
  sydney b
WHERE
  ST_Covers (b.geometry, s.geometry)
UNION ALL
SELECT
  s.primary_name AS station_name,
  'light_rail' AS station_type,
  ST_PointOnSurface (s.geometry) AS geometry
FROM
  user_data.ingest_xsxypfvumiaw_frastructure_df757218 s,
  sydney b
WHERE
  ST_Covers (b.geometry, s.geometry)
The railway layer is simpler: every segment that intersects the boundary (ST_Intersects), with a quick bounding-box check (&&) first.
Gaps and uncertainties
MapAI flagged two:
- Railway segments crossing the boundary were kept whole, not clipped, so a few lines poke out past the edge of Greater Sydney.
- The data comes from different years: the stations and railways are from Overture release 2026-10-21.0, while the GCCSA boundary is from 2021.
Same again, somewhere else
The nice thing about a map you made from a prompt is that the prompt is reusable. I ran the same for London by simply asking:
can you do the same for Camden, London
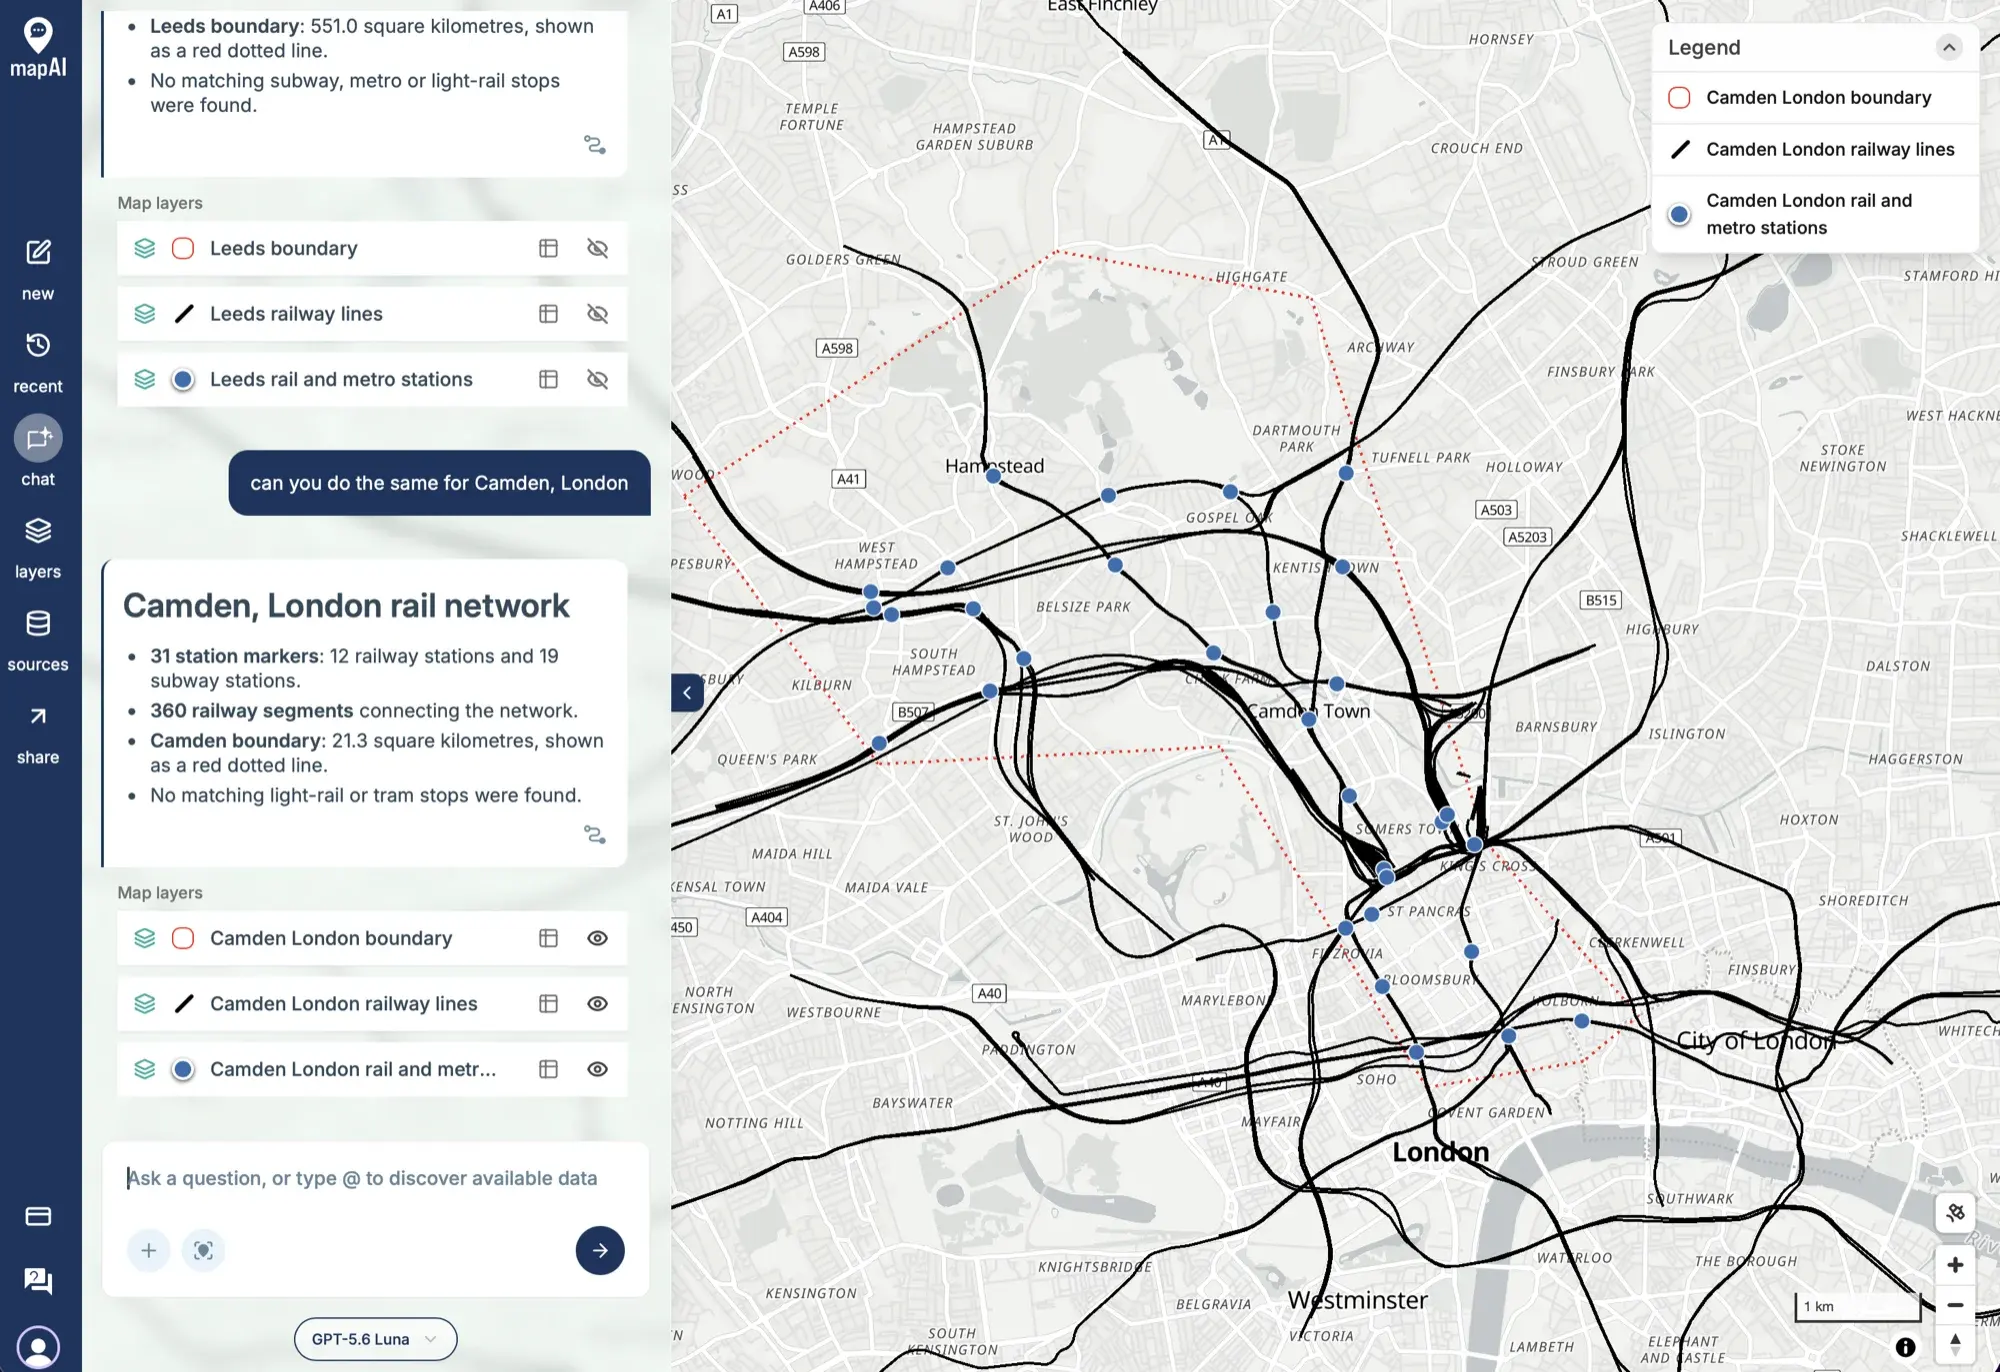
MapAI reused the method and the styling from the earlier turns and found the Camden boundary itself. This time it took 20 tool calls and just under 2 minutes (118 seconds), and came back with:
- 31 station markers: 12 railway stations and 19 subway stations.
- 360 railway segments connecting the network.
- The Camden boundary, 21.3 square kilometres, as a red dotted line.
It also told me what it did not find. For Camden, there were no matching light-rail or tram stops. That kind of “here is what’s missing” note is exactly what I want from a tool like this.
What I noticed
Sydney’s network is a spider web. Almost every line runs into the CBD, and the stations string out along them like beads. The thick black patches are not mistakes: they are rail yards and sidings, where dozens of parallel tracks sit side by side.
Camden is the opposite story. It is a small borough, but the lines are dense, because three of London’s big terminals (King’s Cross, St Pancras and Euston) sit on its southern edge. Plenty of the lines on that map pass straight through Camden without a single stop.
Same prompt, two cities, two very different shapes.
Day 2 done. Tomorrow: polygons.
#30DayMapChallenge #mapai #madewithmapai