Day 3 of the #30DayMapChallenge 2026.
Polygons — A map challenge classic. Map with polygons.
After two days of points and lines, it is time for polygons, and there is no better source of polygons in Australia than the ABS. For Day 3 I asked MapAI to show where Sydney’s population has grown, and shrunk, over the last five years.
The prompt
This one was longer than the first two, because I wanted the answer as well as the map:
Using the ABS Data API, fetch the estimated resident population (ERP) by SA2 for Greater Sydney (use GCCSA boundary) for the latest year available and for five years earlier. Use the SA2 boundaries that match the ERP data.
Calculate for each SA2:
- the population in both years
- the absolute change
- the percentage change
Output 2 layers.
- SA2 polygons as a choropleth of percentage change. Use a diverging palette centred on 0%: red for decline, white near zero and dark blue for strong growth. Use thin light grey outlines. Grey out SA2s with fewer than 500 residents in the latest year and label them “Low population” in the tooltip.
- Greater Sydney boundary (dark grey dotted line, no fill).
Order the layers so the boundary is on top. Configure tooltips in this order: SA2 name, population (earlier year), population (latest year), change, % change.
In your answer, tell me the 5 fastest-growing and 5 fastest-declining SA2s (excluding low-population ones), the overall change for Greater Sydney, and which years and boundary edition you used.
What MapAI found
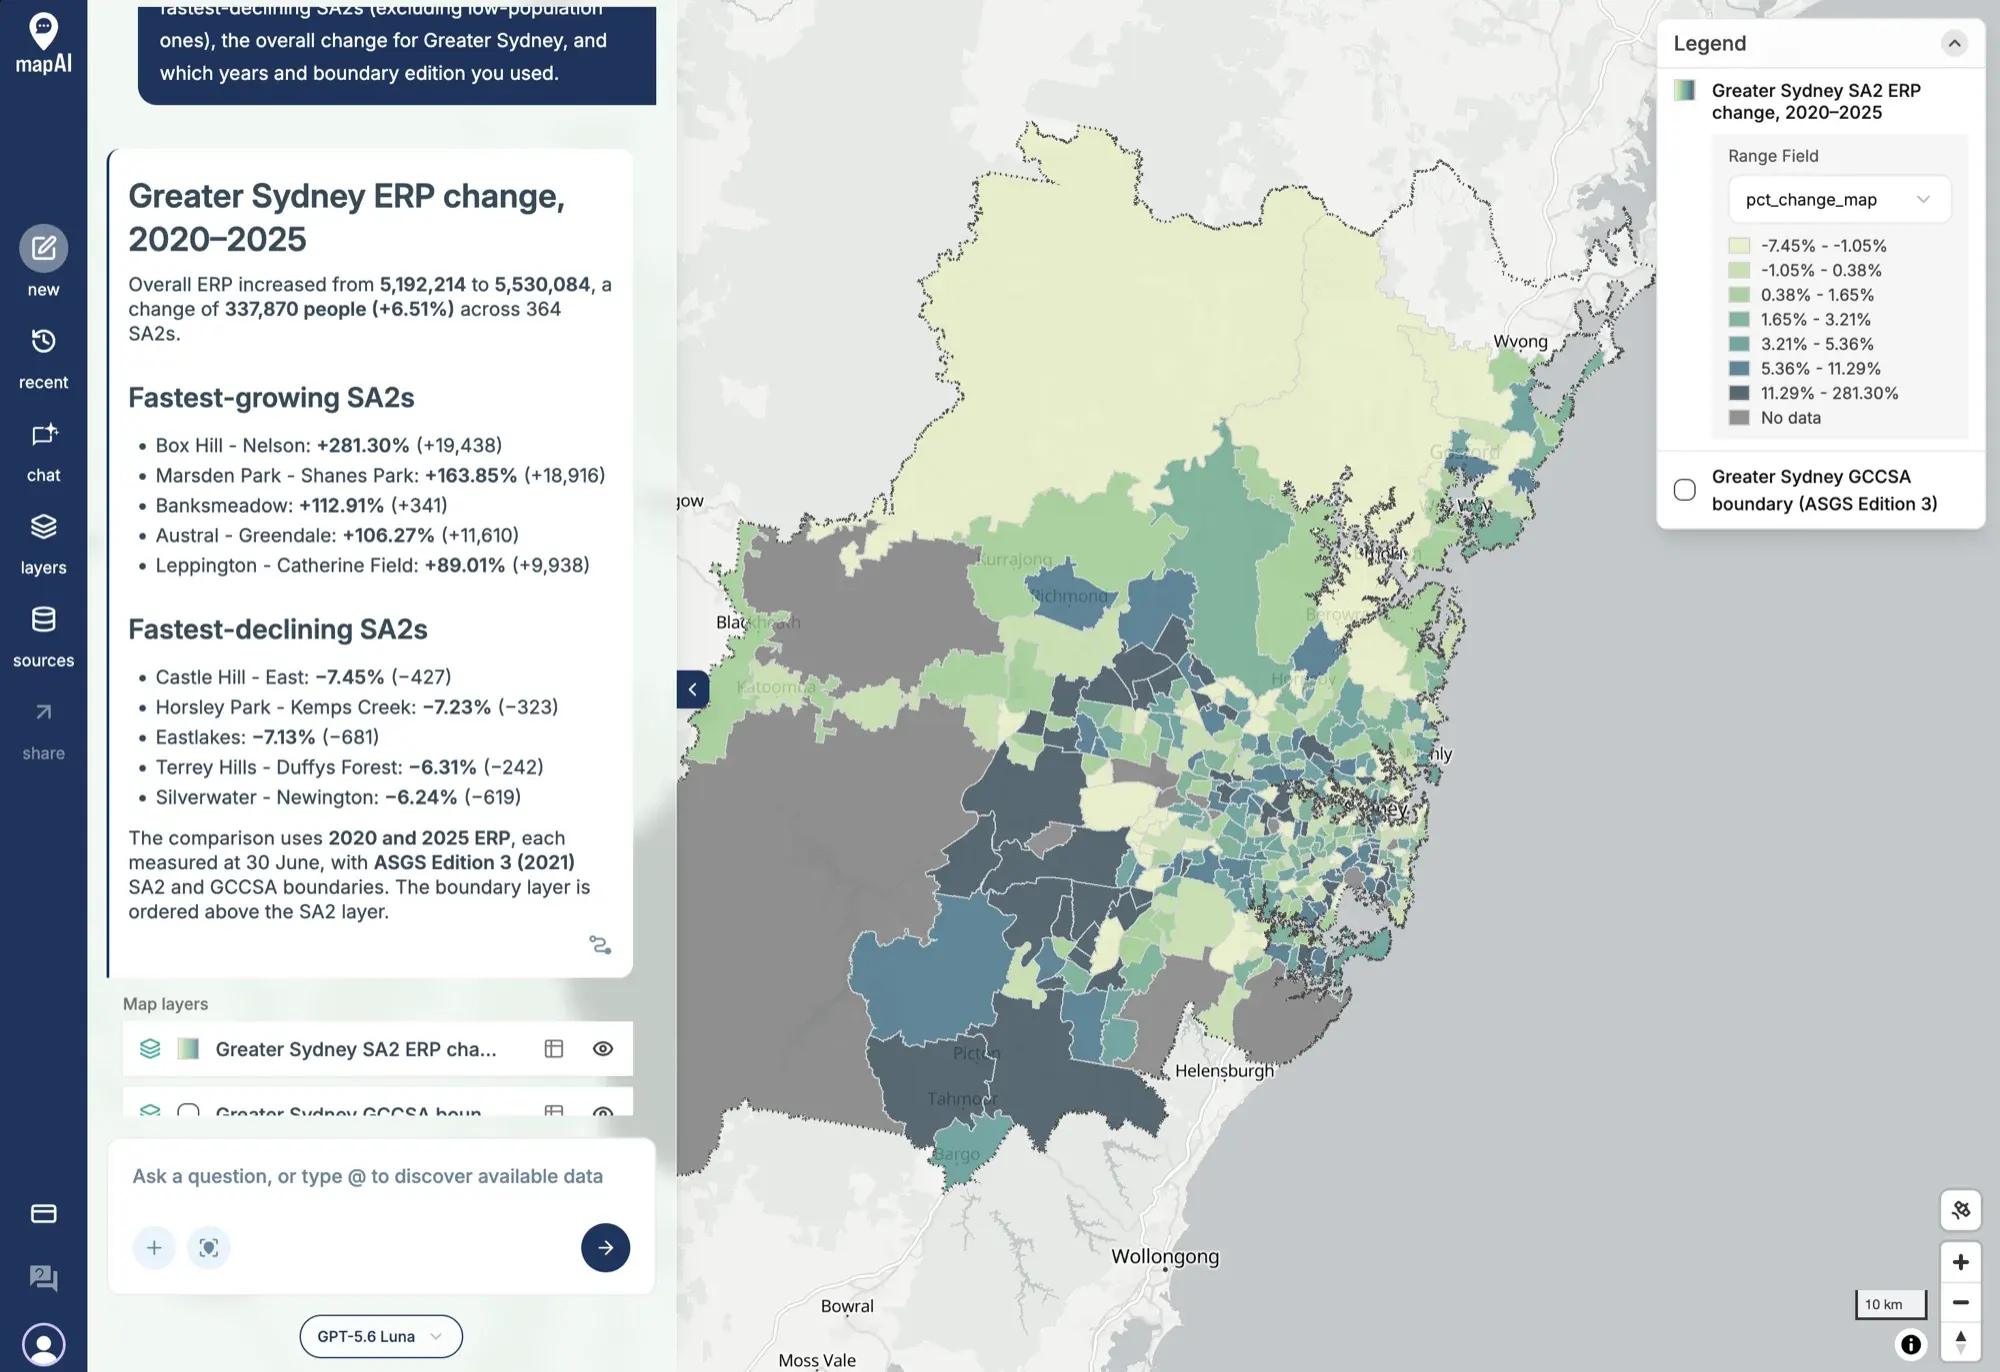
Greater Sydney grew from 5,192,214 people in 2020 to 5,530,084 in 2025. That is 337,870 more people (+6.51%) across 364 SA2s.
The fastest-growing SA2s:
| SA2 | Change | People |
|---|---|---|
| Box Hill - Nelson | +281.30% | +19,438 |
| Marsden Park - Shanes Park | +163.85% | +18,916 |
| Banksmeadow | +112.91% | +341 |
| Austral - Greendale | +106.27% | +11,610 |
| Leppington - Catherine Field | +89.01% | +9,938 |
The fastest-declining SA2s:
| SA2 | Change | People |
|---|---|---|
| Castle Hill - East | −7.45% | −427 |
| Horsley Park - Kemps Creek | −7.23% | −323 |
| Eastlakes | −7.13% | −681 |
| Terrey Hills - Duffys Forest | −6.31% | −242 |
| Silverwater - Newington | −6.24% | −619 |
Both rankings leave out the 13 SA2s with fewer than 500 residents in 2025.
What MapAI did
By the numbers, this map took:
- 26 tool calls
- About 3 minutes 45 seconds (225 seconds) from prompt to finished map
- About 144 credits
Here is its evidence trail, in its own words where possible.
How it understood the question
- Source: estimated resident population (ERP) by SA2 from the ABS Data API.
- Geography: SA2s restricted to the Greater Sydney GCCSA.
- Time: “latest available” means 2025, compared with 2020, each measured at 30 June.
- Threshold: “low population” means fewer than 500 residents in 2025.
- Rankings: based on percentage change, excluding low-population SA2s.
- Boundaries: SA2 and GCCSA boundaries from ASGS Edition 3, released in 2021, so the data and the polygons match.
The workflow
- Discovered the ABS ERP dataflow and confirmed its SA2, GCCSA and annual dimensions.
- Inspected the dataflow structure and selected the 2025 and 2020 observations.
- Fetched the ERP observations with matching ASGS Edition 3 SA2 boundaries.
- Fetched the Greater Sydney GCCSA boundary from the same ASGS edition.
- Calculated the absolute and percentage changes and identified 13 low-population SA2s.
- Ranked the remaining SA2s and saved the SA2 and GCCSA layers.
The SQL
The heart of it is a simple pivot. The ERP table has one row per SA2 per year, so MapAI turns the two years into two columns before calculating the change:
SELECT
  sa2_code_2021,
  MIN(sa2_name_2021) AS sa2_name,
  MAX(
    CASE
      WHEN time_period = '2020' THEN erp
    END
  ) AS population_earlier,
  MAX(
    CASE
      WHEN time_period = '2025' THEN erp
    END
  ) AS population_latest
FROM
  user_data.abs_erp_sa2_greater_sydney_2a1cf26b
WHERE
  gccsa_code_2021 = '1GSYD'
  AND time_period IN ('2020', '2025')
GROUP BY
  sa2_code_2021
The map layer then works out the change, with NULLIF guarding against division by zero, and sets the mapped value to NULL for low-population SA2s so they show as grey:
CASE
  WHEN p.population_latest < 500 THEN NULL
  ELSE ROUND(
    (
      (p.population_latest - p.population_earlier) / NULLIF(p.population_earlier, 0) * 100
    )::numeric,
    2
  )
END AS pct_change_map
Two more queries produce the Greater Sydney totals and the top 5 rankings, and a fourth fetches the boundary.
Gaps and uncertainties
MapAI flagged two:
- It could not use the palette I asked for. MapAI’s supported choropleth palettes do not include a red-white-dark-blue diverging ramp, so it used the closest supported blue ramp instead.
- 13 of the 364 SA2s had fewer than 500 residents in 2025 and were left out of the rankings.
You can explore the live map here: 03 Polygons - Growth in Sydney.
What I noticed
Sydney is growing at its edges. The darkest polygons sit on the north-west and south-west fringes: Box Hill, Marsden Park, Austral and Leppington. Box Hill - Nelson almost quadrupled in five years, adding nearly 20,000 people. Those are new suburbs being built on what was farmland not long ago.
Banksmeadow is the odd one out in the top 5. It more than doubled, but that is only 341 extra people on a small base. Percentages flatter small places, which is exactly why the 500-resident threshold matters, and why I asked for the absolute change too.
The declines are modest by comparison: no SA2 lost more than 7.5% of its people. Most of the inner and middle ring sits in the lighter greens, growing slowly or barely at all.
One honest note on the map itself. With a sequential palette instead of a diverging one, the SA2s that shrank are only a shade lighter than the ones that stayed flat. I like that MapAI told me it could not do what I asked rather than quietly swapping it, and a diverging ramp is now on my list for the MapAI team.
Day 3 done. Tomorrow: clusters.
#30DayMapChallenge #mapai #madewithmapai