Day 8 of the #30DayMapChallenge 2026.
Utopia — A map of something which could be.
The “15-minute city” is one of urban planning’s favourite utopias: everything you need for daily life within a short walk of home. For Day 8, I asked MapAI how close Sydney is to it, and where the city could get closer: how many Sydneysiders live within 800 metres of a station, a school, a supermarket and a park, and where would one new station or school make the biggest difference?
Getting there
This is my second attempt at Day 8. The first one, a housing scenario around stations in Canterbury-Bankstown, produced a number that didn’t stand up to a sanity check, so I took it down.
This one is built on the Day 4 method, which worked: dissolved 800-metre catchments, population from ABS, and a share of each SA2’s area. It’s an 800-metre straight-line distance, roughly a 10-minute walk, so strictly this is the 10-minute city.
The prompt
The 15-minute Sydney: a utopia check across Sydney.
- Select all SA2s (ASGS Edition 3) whose SA4 name starts with “Sydney - ”. Use 2025 ABS ERP for each SA2.
- Find four amenity types within the area covered by those SA2s: railway, metro and light rail stations; schools; supermarkets (Overture Places); and parks.
- For each amenity type, buffer by 800 m and dissolve into one catchment per type.
- For each SA2, calculate the share of its area inside all four catchments. Apply that share to its population to estimate residents in the 15-minute ideal (assume people are spread evenly).
- Mark the gaps. Find the area covered by exactly three of the four catchments, and record which amenity is missing there. For each SA2, report the missing amenity that covers the most area, and the estimated residents a new one would add to the ideal.
Output 3 layers:
- SA2s as a choropleth of the share of residents in the 15-minute ideal (red at 0%, green at 100%). Grey out SA2s with fewer than 500 residents.
- The “three of four” gap areas, coloured by the missing amenity (station, school, supermarket, park), semi-transparent.
- Stations as small dark dots.
Tooltips for SA2s: SA2 name, SA4 name, population, % in the 15-minute ideal, most common missing amenity, and estimated residents added if it were provided.
Tell me the Sydney-wide share of residents in the 15-minute ideal, the top 5 and bottom 5 populous SA2s, and the 5 SA2s where one new station would add the most residents, and the same for one new school. List your assumptions.
What MapAI found
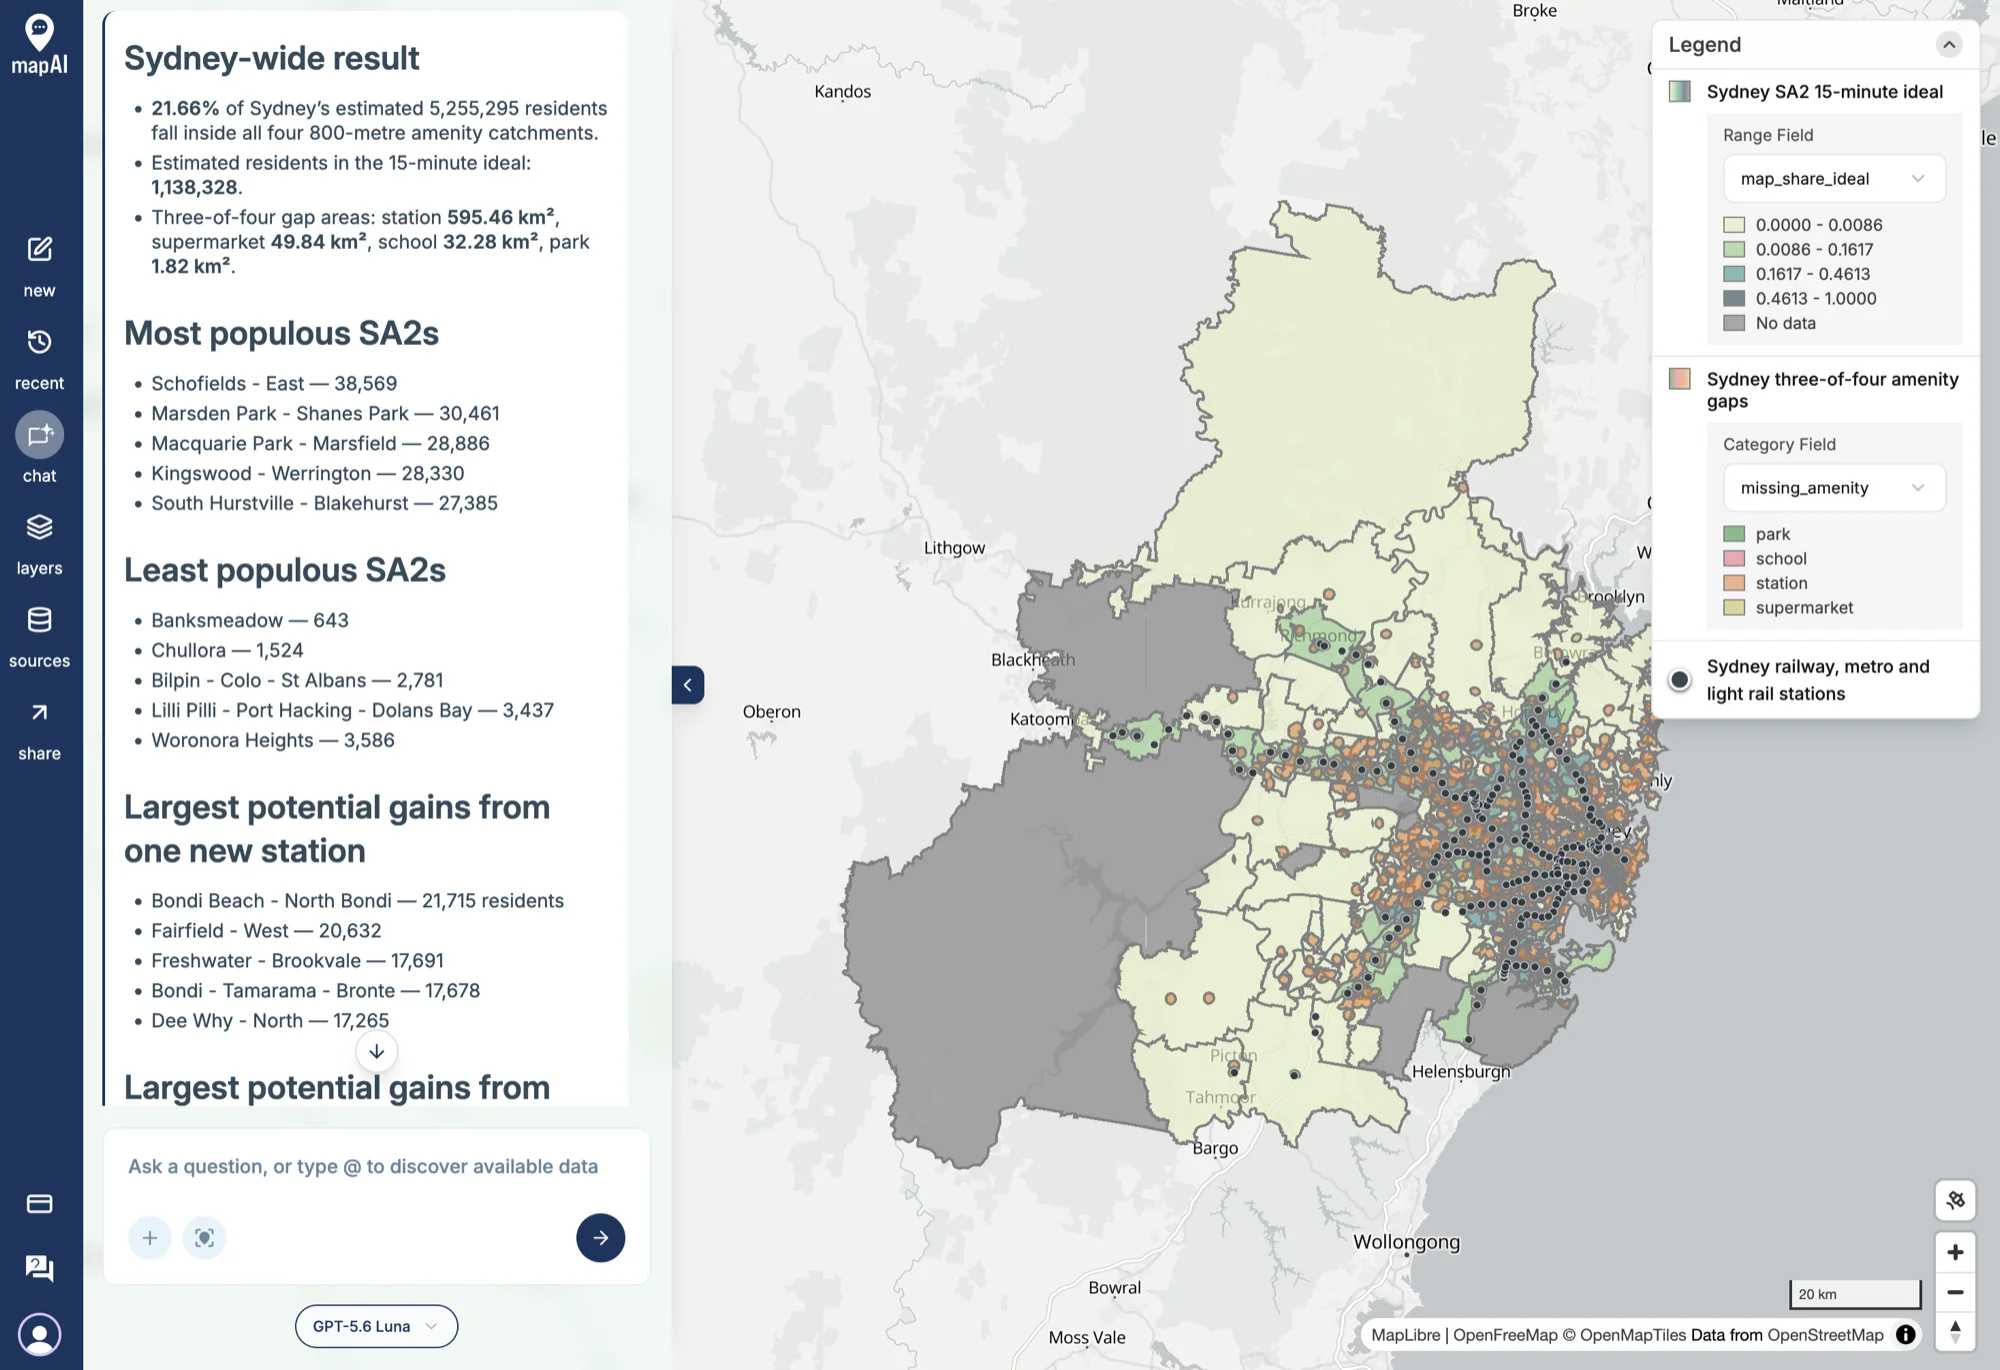
- 21.66% of Sydney’s 5,255,295 residents live within 800 metres of all four: about 1,138,328 people.
- The areas that have three of the four are missing:
- a station: 595.46 km²
- a supermarket: 49.84 km²
- a school: 32.28 km²
- a park: 1.82 km²
Where one new station would add the most residents to the ideal:
| SA2 | Residents added |
|---|---|
| Bondi Beach - North Bondi | 21,715 |
| Fairfield - West | 20,632 |
| Freshwater - Brookvale | 17,691 |
| Bondi - Tamarama - Bronte | 17,678 |
| Dee Why - North | 17,265 |
And where one new school would:
| SA2 | Residents added |
|---|---|
| Rhodes | 6,878 |
| Pyrmont | 6,719 |
| Mascot | 4,789 |
| Baulkham Hills (West) - Bella Vista | 4,444 |
| Campbelltown - Woodbine | 4,308 |
What MapAI did
By the numbers, this map took:
- 43 tool calls
- About 18 minutes 10 seconds (1,093 seconds) from prompt to finished map
- About 226 credits
Here is its evidence trail, in its own words where possible.
How it understood the question
- Source: ABS 2025 ERP, Overture places and infrastructure, and MapAI’s core amenity records.
- Measure: residents inside all four catchments, estimated from SA2 area shares.
- Geography: SA2s where the ASGS Edition 3 SA4 name starts with “Sydney - ”.
- Time: the 2025 ERP.
- Threshold: an 800-metre buffer for each amenity catchment.
- Categories: schools include primary, high, combined, special and preschool records; parks use records classified as parks; supermarkets use Overture grocery stores.
- Assumption: residents are spread evenly across each SA2.
- Output: three layers for SA2 performance, three-of-four gaps and station locations.
The workflow
- Selected 340 Sydney SA2s whose SA4 names matched the prefix.
- Retrieved 2025 ERP and kept the matching SA2 boundaries.
- Selected the station, school, supermarket and park records within the combined SA2 footprint.
- Buffered each amenity type by 800 metres and dissolved each into one catchment.
- Calculated four-way coverage, three-way gaps and population estimates for every SA2.
- Ranked the estimated gains from one additional station or school.
- Saved the SA2, gap and station layers.
The data
- ABS Data API for the 2025 ERP and the SA2 boundaries.
- Overture Infrastructure for the stations.
- Overture Places for the supermarkets.
- Amenities from MapAI’s base database for schools and parks.
Gaps and uncertainties
MapAI flagged three:
- 48 station records were areas rather than points, and were left out of the station dots and catchments.
- Schools and parks are points, not footprints. A large park is measured from a single point, not its edge.
- No exact red-to-green colour ramp was available, so it used the closest supported ramp.
You can explore the live map here: 08 Utopia - Amenities.
What I noticed
Sydney’s missing piece is the train. Of all the places that are one amenity short of the ideal, nearly nine-tenths (595 of 679 km²) are missing a station. Parks are almost never the problem: just 1.82 km² is missing only a park. Schools and supermarkets are mostly where people are; the rail network isn’t.
The station list reads like a wish list Sydney already knows. Bondi Beach and Bondi - Tamarama - Bronte are two of the five. A station at Bondi Beach has been proposed, shelved and argued about for decades. The Northern Beaches, with Freshwater - Brookvale and Dee Why - North, have no rail at all, only buses. A map built from nothing but buffers and population lands right on the long-running debates.
The school list is about new apartments. Rhodes, Pyrmont and Mascot have all filled up with apartments over the last 20 years. The residents arrived, along with the supermarkets and the stations, and in the data at least, the schools haven’t caught up. It’s the same story as Marsden Park on Day 4, in a very different part of Sydney.
One of my questions came back wrong, and that’s on me. I asked for “the top 5 and bottom 5 populous SA2s”, meaning the best and worst-served of the larger SA2s. MapAI read it as the most and least populous SA2s, and listed Schofields - East (38,569) down to Banksmeadow (643). That’s a fair reading of an ambiguous sentence. The tooltips on the live map have the shares for every SA2, so the answer is still there.
21.66% is believable. On Day 4, 13.42% of Sydneysiders lived within 800 metres of a cafe strip. One supermarket, one school, one park and one station is an easier test than a cafe strip, but needing all four makes it a harder one, so landing near a fifth feels about right.
The usual caveats apply: straight lines aren’t walking routes, people aren’t spread evenly across SA2s, and a point for a large park understates how close it really is.
So, the utopia check: about one in five Sydneysiders already lives in the 10-minute city. For many of the rest, the missing piece is a station.
Day 8 done. Tomorrow: urban–rural.
#30DayMapChallenge #mapai #madewithmapai