Day 9 of the #30DayMapChallenge 2026.
Urban-rural — Urban or rural. Cities and countryside.
Instead of mapping the city and the countryside separately, I wanted to map the change from one to the other. So for Day 9 I asked MapAI to draw a single straight line from Sydney Town Hall to Lithgow, over the Blue Mountains, and tell me what happens along it: where does the city end, and where does the country begin?
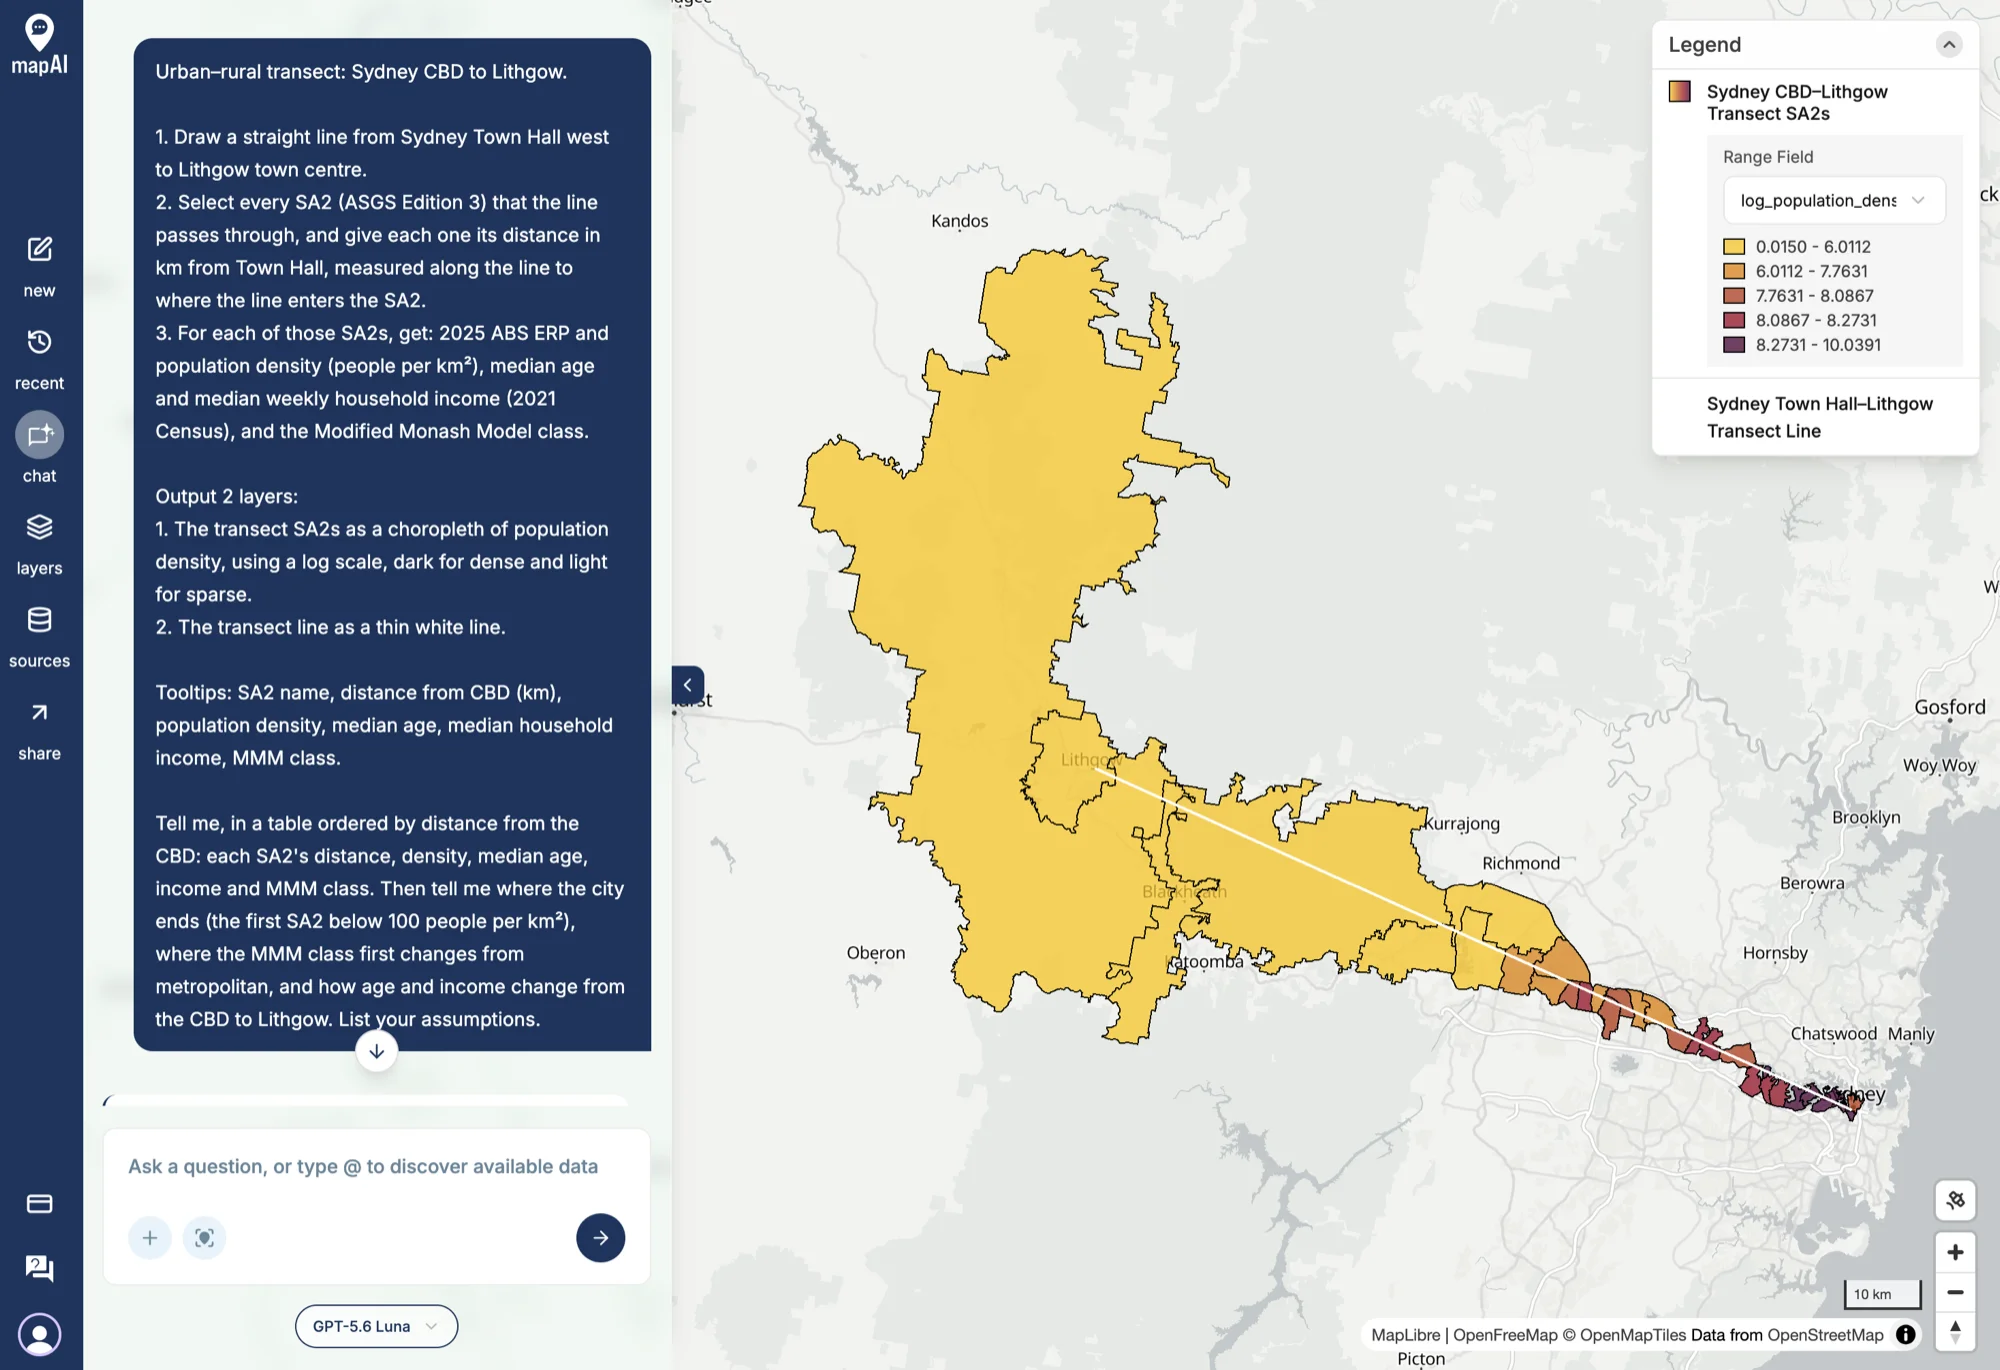
The prompt
Urban–rural transect: Sydney CBD to Lithgow.
- Draw a straight line from Sydney Town Hall west to Lithgow town centre.
- Select every SA2 (ASGS Edition 3) that the line passes through, and give each one its distance in km from Town Hall, measured along the line to where the line enters the SA2.
- For each of those SA2s, get: 2025 ABS ERP and population density (people per km²), median age and median weekly household income (2021 Census), and the Modified Monash Model class.
Output 2 layers:
- The transect SA2s as a choropleth of population density, using a log scale, dark for dense and light for sparse.
- The transect line as a thin white line.
Tooltips: SA2 name, distance from CBD (km), population density, median age, median household income, MMM class.
Tell me, in a table ordered by distance from the CBD: each SA2’s distance, density, median age, income and MMM class. Then tell me where the city ends (the first SA2 below 100 people per km²), where the MMM class first changes from metropolitan, and how age and income change from the CBD to Lithgow. List your assumptions.
A transect is an old idea from ecology and urban planning: walk a line across a landscape and record what changes. The line here is 103.34 km long and crosses 32 SA2s.
What MapAI found
- The city ends at 55.22 km. Yarramundi - Londonderry is the first SA2 along the line with fewer than 100 people per km².
- The country begins at 57.92 km. Blue Mountains - North is where the Modified Monash Model class first changes, from “Metropolitan areas” straight to “Small rural towns”.
- Age rises: the median age goes from 37 in the CBD to 46 in Lithgow, with a peak of 61 in Blue Mountains - North.
- Income falls: median weekly household income drops from $2,457 in the CBD to $1,088 in Lithgow, down $1,369, or 55.7%.
What MapAI did
By the numbers, this map took:
- 32 tool calls
- About 8 minutes 45 seconds (526 seconds) from prompt to finished map
- About 200 credits
Here is its evidence trail, in its own words where possible.
How it understood the question
- Source: 2025 ABS ERP on ASGS Edition 3 SA2 boundaries, 2021 Census medians, and the 2023 Modified Monash Model.
- Measure: population density is ERP divided by SA2 area; the Census measures are median age and median total household income.
- Geography: the SA2s crossed by a straight line from Sydney Town Hall to Lithgow town centre.
- Time: ERP is 2025 and the Census measures are from 2021.
- Threshold: the city ends at the first SA2 along the line below 100 people per km².
- Assumptions:
- Sydney Town Hall is the G-NAF point at 483 George Street, and Lithgow town centre is 19A Main Street.
- An SA2 counts if more than 1 metre of the line passes through it.
- Distances are geodesic, measured along the line to where it first crosses each SA2’s boundary.
- Each SA2’s MMM class is the class nearest the midpoint of the line’s path through it.
- The colour scale uses ln(1 + density).
- Output: two layers, the log-density SA2 choropleth and the white transect line.
The workflow
- Inspected the ABS dataflows for Edition 3 ERP and the 2021 Census medians.
- Fetched 2025 ERP and the 2021 Census measures for SA2s across the Sydney–Lithgow extent.
- Matched the 32 SA2s crossed by the transect and calculated each one’s entry distance from Town Hall.
- Assigned each SA2 an MMM class using the midpoint of its stretch of the line.
- Saved the SA2 choropleth and the white transect line.
The data
- ABS Data API for the 2025 ERP, the 2021 Census medians and the SA2 boundaries.
- Modified Monash Model 2023 for the remoteness classes.
- G-NAF Addresses for the two ends of the line.
The SQL
The neat trick is how MapAI measured each SA2’s distance from the CBD.
It found the points where the line crosses each SA2’s boundary, and used ST_LineLocatePoint to turn the first crossing into a fraction of the way along the line:
CASE
  WHEN ST_Covers (x.geometry, x.cbd) THEN 0.0
  ELSE (
    SELECT
      MIN(ST_LineLocatePoint (x.transect, d.geom))
    FROM
      ST_DumpPoints (ST_CollectionExtract (x.boundary_hits, 1)) d
  )
END AS entry_fraction
Multiply that fraction by the line’s 103.34 km, and you have the distance from Town Hall.
Gaps and uncertainties
MapAI flagged three:
- Lithgow town centre is a single G-NAF address on Main Street.
- Each SA2’s MMM class is the class nearest to the midpoint of its stretch of the line, so an SA2 that spans two classes gets only one.
- Age and income are from the 2021 Census, not 2025.
You can explore the live map here: 09 Urban Rural - Sydney to Lithgow.
What I noticed
Sydney’s edge is sharp. The city ends at 55 km and the country begins less than 3 km later. There’s no slow fade from suburbs to farmland, and the remoteness class jumps straight from “Metropolitan” to “Small rural towns”, skipping the classes in between. Looking at the map, the line leaves the suburbs at the Hawkesbury and goes almost straight into the Blue Mountains, so geography does most of the work: once the land runs out, so does the city.
A straight line doesn’t follow the road. Most people drive or take the train to Lithgow along the Great Western Highway, through Katoomba and Blackheath. This line runs further north, closer to the Bells Line of Road, through Yarramundi and Blue Mountains - North. So this transect tells the story of a different route over the mountains, and probably a quieter one than the highway towns.
The oldest place isn’t at the end of the line. The median age peaks at 61 in Blue Mountains - North, well above Lithgow’s 46. My guess is that’s the tree-change effect: people retiring to the mountains, within reach of Sydney but out of the suburbs. Lithgow is a working town, and it’s younger.
Income more than halves. The median household in the CBD SA2 earns $2,457 a week; in Lithgow, $1,088. That’s a 55.7% drop over 103 km. It’s the Census in 2021, so the numbers are a few years old, but the gap is unlikely to have closed.
One line, 32 SA2s, and the whole urban-rural story in one map.
Day 9 done. Tomorrow: prompting only, which, for a challenge made entirely in MapAI, might be the easiest theme of the month.
#30DayMapChallenge #mapai #madewithmapai