Day 12 of the #30DayMapChallenge 2026.
Power — Power as in nuclear power? Or physical power or influence? Power grid on a map? Read this the way you want, like every other prompt.
I went with political power. In a democracy, the most basic unit of power is a vote. One person, one vote, one value.
But every federal electorate in Australia elects exactly one MP to the House of Representatives, and electorates don’t all hold the same number of people. If your electorate is smaller, your vote carries more weight. So for Day 12 I asked MapAI: how much is your vote worth?
The prompt
How much is your vote worth? Federal electorates, Australia.
- Get the latest ABS Estimated Resident Population (ERP) for every Commonwealth Electoral Division (CED), with matching CED boundaries. Use the most recent CED edition available and tell me which edition and ERP year you used.
- Each division elects one MP. Calculate the national average population per division. Then, for each division, calculate its vote value = national average ÷ division population. For example, 1.20 means a vote there is worth 20% more than average.
- Calculate the same by state and territory: total population ÷ number of divisions, and its vote value against the national average.
Output 2 layers on a light grey basemap:
- Divisions as a diverging choropleth of vote value centred on 1.0. Use purple for worth more than average (above 1.0), orange for worth less (below 1.0), and near-white for close to 1.0.
- Division boundaries as thin dark grey lines, with state boundaries slightly thicker.
Tooltips: Division name, State, Population, Vote value, Difference from average (%).
Tell me:
- the number of divisions and the national average population per division
- a table by state and territory: divisions, population, population per division and vote value, ordered by vote value
- the 5 divisions where a vote is worth the most and the 5 where it is worth the least, with state and population
- the ratio between the most and least valuable vote
- your assumptions, including that seats are allocated by enrolment, not total population
What MapAI found
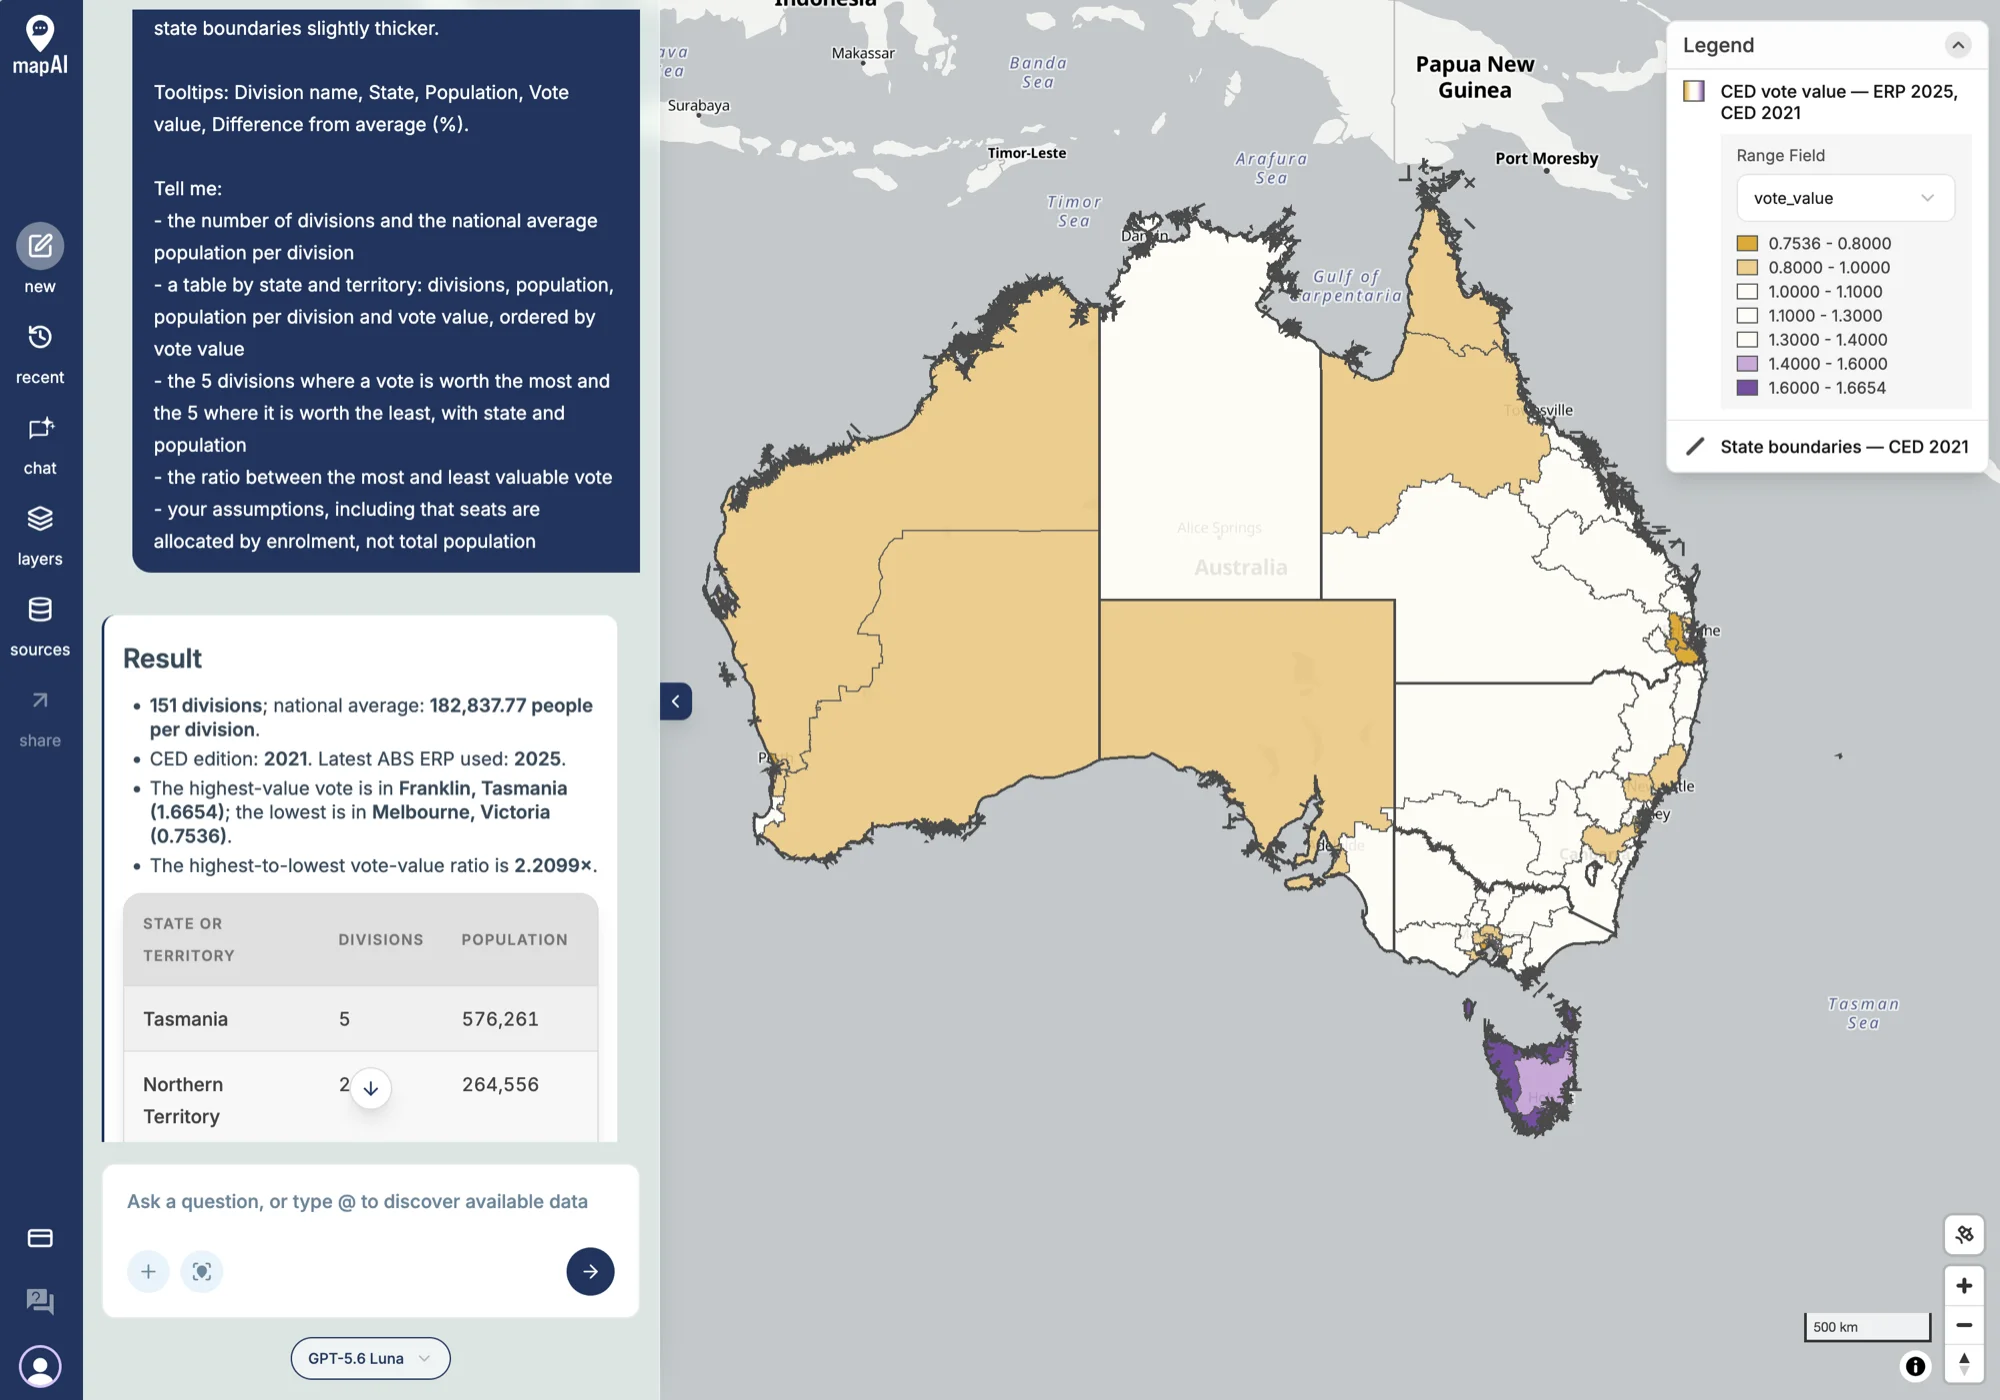
- 151 divisions, with a national average of 182,838 people per division.
- The most valuable vote is in Franklin, Tasmania, at 1.67: a vote there is worth two-thirds more than average.
- The least valuable vote is in Melbourne, Victoria, at 0.75: a quarter less than average.
- A vote in Franklin is worth 2.21 times a vote in Melbourne.
By state, Tasmania tops the table: 5 divisions for 576,261 people, about 115,000 per seat. The Northern Territory is next: 2 divisions for 264,556 people, about 132,000 per seat. Working those through against the national average gives a vote value of about 1.59 for Tasmania and 1.38 for the Northern Territory.
What MapAI did
By the numbers, this map took:
- 26 tool calls
- About 19 minutes (1,144 seconds) from prompt to finished map
- About 202 credits
Here is its evidence trail, in its own words where possible.
How it understood the question
- Source: ABS Estimated Resident Population from the 2025 SA2 series.
- Measure: ERP at 30 June 2025.
- Geography: Commonwealth Electoral Divisions from the 2021 CED edition.
- Output: one MP per division, with vote value measured against the national population per division.
- Assumption: SA2 populations apportioned to divisions by the share of each SA2’s area that falls inside them.
- Assumption: seats are allocated by enrolment, not total population, so this is a population comparison, not an entitlement calculation.
The workflow
- Inspected the ABS ERP and Census CED data structures.
- Fetched 2025 SA2 ERP and the 2021 CED boundaries.
- Apportioned each SA2’s population to the divisions it overlaps, by area share.
- Calculated vote values at the national, state and division level.
- Checked that all 2,450 SA2s were fully covered by division boundaries.
- Saved the division choropleth and the state boundary layer.
The data
Both layers come from the ABS Data API: 2025 ERP by SA2 and the 2021 Commonwealth Electoral Division boundaries.
The SQL
The ABS doesn’t publish ERP directly by electorate, so MapAI built it. Each SA2’s population is split between the divisions it overlaps, in proportion to the area that falls in each:
SUM(
  s.erp * ST_Area (
    ST_Intersection (c.geometry, s.geometry)::geography
  ) / NULLIF(s.sa2_area, 0)
) AS population
Vote value is then a single division:
n.national_average / NULLIF(a.population, 0) AS vote_valueGaps and uncertainties
MapAI flagged three:
- Division populations are estimates, because the ABS publishes ERP by SA2 rather than by division.
- Area weighting assumes people are spread evenly within each SA2.
- Population is not enrolment. Seats are allocated using enrolled voters under the Commonwealth Electoral Act, so these vote values do not reproduce how seats are actually allocated.
You can explore the live map here: 12 Power - Vote Value Australia.
What I noticed
The boundaries are doing their job
The first thing the map shows is how much of it is white. Inside each state, most divisions sit close to the average.
That is not luck. Australia has independent redistributions for exactly this reason. For federal seats, the Australian Electoral Commission redraws Commonwealth Electoral Division (CED) boundaries so that each division in a state has roughly the same number of enrolled voters, within a set tolerance of the state’s quota. The states do the same for their own State Electoral Divisions (SEDs). Compared with countries where boundaries are drawn by politicians, or not redrawn for decades, Australia does this well.
But some disparity remains
The colour that is left comes from three places.
Between states. Seats are first shared out between the states and territories, and only then divided up inside each one. The Constitution guarantees each original state at least five seats, which is why Tasmania, with about 576,000 people, has five, and why every Tasmanian division is purple. The territories’ small seat counts mean each of their seats represents its own unusual number of people. No redistribution inside a state can fix a gap between states.
Between people and voters. Boundaries are equalised by enrolment, not population. An electorate with lots of children, or lots of residents who are not citizens, such as international students and recent migrants, can have an average number of voters but far more residents. That is my best guess for why Melbourne, the inner-city division, comes out as the least valuable vote on a population count. It is also the most important caveat on this map: a population-based vote value measures who is represented, not who votes.
Between redistributions. Boundaries are set at a point in time and then populations move. This map pairs 2021 boundaries with 2025 populations, so fast-growing areas will look over-full and slow-growing ones under-full. That is also why the 2021 edition still has 151 divisions. The House was cut to 150 seats for the 2025 election, with Western Australia gaining one and New South Wales and Victoria losing one each. The orange across Western Australia on this map is the under-representation that redistribution was designed to fix.
What the trail adds
This is a good example of why the trail matters. The headline, “a vote in Franklin is worth 2.2 times a vote in Melbourne”, is striking. But the intent panel tells you it uses 2021 boundaries, the workflow tells you the populations are apportioned by area, and the gaps panel tells you it is population, not enrolment. All three change how far you can push the headline.
The coverage check was a nice touch too: MapAI confirmed that every one of the 2,450 SA2s was fully covered by a division before it trusted the totals.
A better second pass would use the current CED edition and AEC enrolment by division instead of ERP. That would show how much of the gap is the Constitution, and how much is just who lives where.
Day 12 done. Tomorrow: interactions.
#30DayMapChallenge #mapai #madewithmapai