Day 14 of the #30DayMapChallenge 2026.
Borgesian map — A map so detailed it becomes the territory. Inspired by Borges’ On Exactitude in Science.
In Borges’ one-paragraph story, an empire’s cartographers become so obsessed with exactness that they draw a map of the empire the same size as the empire, matching it point for point. The next generations decide the map is useless, and leave it to rot in the desert.
For Day 14 I wanted to try the modern version. Not a map the size of the territory, but a map that knows everything about it. I asked MapAI for one place and every layer it could find: lots, buildings, addresses, zoning, height limits, floor space ratios, businesses, infrastructure and amenities. I pointed it at Rosebery, in Sydney’s inner south.
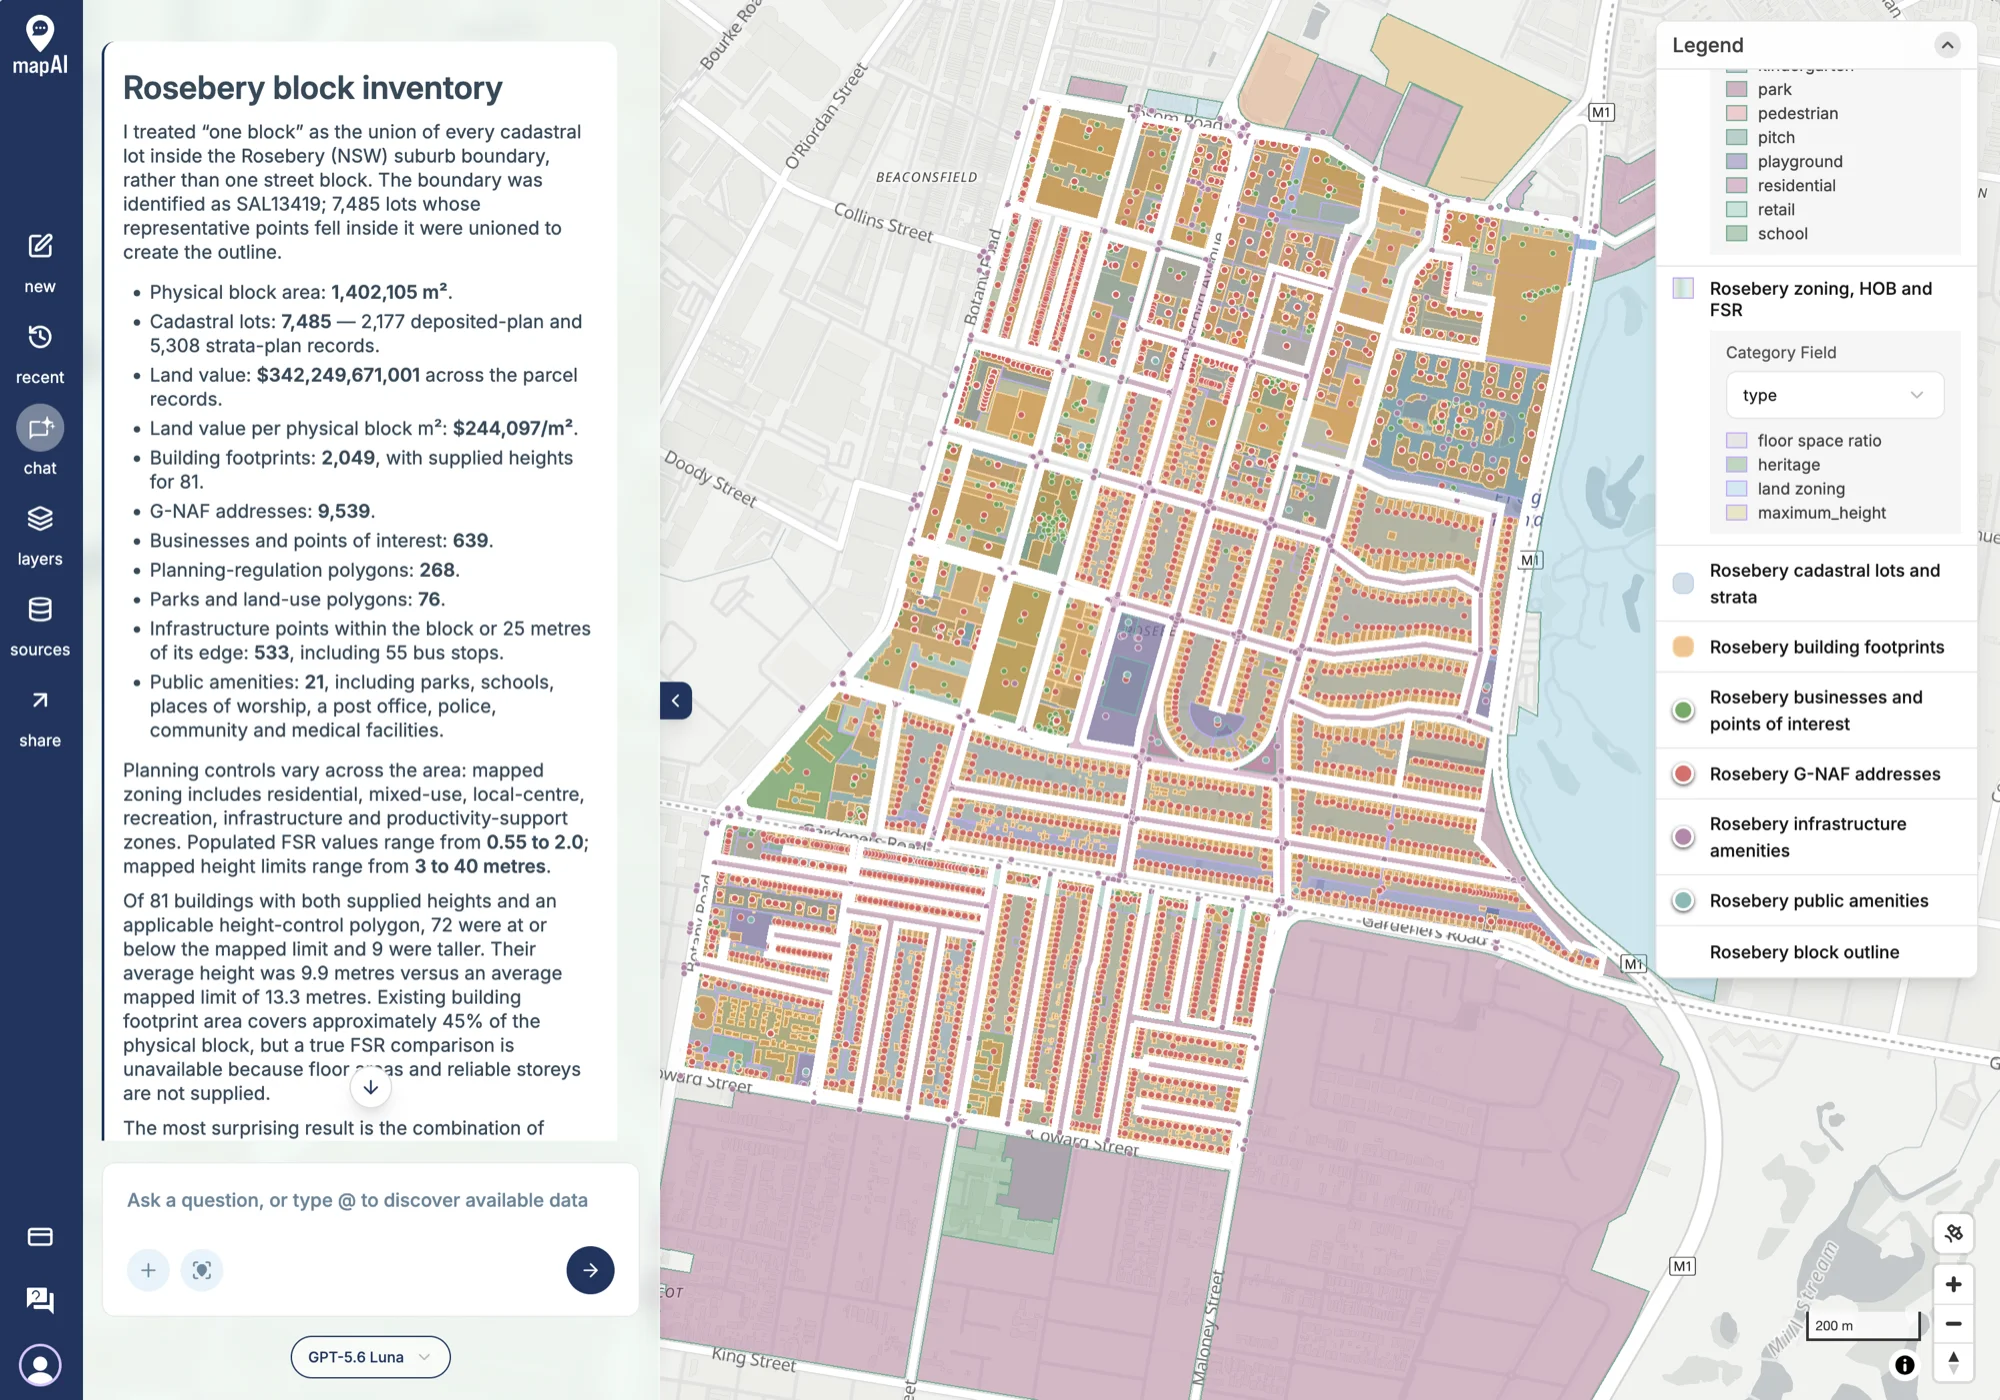
What MapAI found
The first thing MapAI did was redefine the question. Instead of a single street block, it treated the whole suburb as the block: it took the Rosebery suburb boundary (SAL13419) and joined together every cadastral lot whose centre falls inside it. It said so in the first line of the answer, which is exactly where a change like that belongs.
Then it counted everything.
| Layer | Count |
|---|---|
| Cadastral lots | 7,485 (2,177 lots and 5,308 strata) |
| G-NAF addresses | 9,539 |
| Building footprints | 2,049 (81 with a height) |
| Businesses and points of interest | 639 |
| Infrastructure points (incl. 55 bus stops) | 533 |
| Planning control polygons | 268 |
| Parks and land-use polygons | 76 |
| Public amenities | 21 |
- Area: 1,402,105 m², about 1.4 km².
- Zoning: residential, mixed use, local centre, recreation, infrastructure and productivity support.
- Floor space ratios from 0.55 to 2.0, and height limits from 3 to 40 metres.
- Buildings vs height limits: of the 81 buildings with a height, 72 are at or below their limit and 9 are taller. They average 9.9 metres, against an average limit of 13.3 metres.
- Footprint: buildings cover about 45% of the land.
And one more number: $342,249,671,001 of land value, or $244,097 per m².
That last one is wrong, and MapAI said so. More on that below.
What MapAI did
By the numbers, this map took:
- 88 tool calls
- About 27 minutes (1,633 seconds) from prompt to finished map
- About 300 credits
That makes it the biggest run of the challenge so far, which is fair for nine datasets. Here is its evidence trail, in its own words where possible.
How it understood the question
- Geography: the Rosebery (NSW) suburb boundary, SAL13419, defines the area.
- Assumption: “one block” means the union of all cadastral lots whose representative points fall inside Rosebery.
- Assumption: “on the edge” includes features within 25 metres of the outline.
- Measure: land value sums the parcel records, including strata records.
- Comparison: building heights compared with the mapped height limits, where both exist.
The workflow
- Identified the Rosebery suburb boundary and checked its name and code.
- Selected the 7,485 cadastral records whose representative points fall inside it.
- Joined the lots together to make the block outline.
- Matched buildings, places, infrastructure and land use from Overture to the area.
- Filtered G-NAF addresses, planning controls and amenities to the block, or within 25 m of its edge.
- Compared building heights with the height limits.
- Saved nine layers with every attribute in the tooltips.
The data
Nine sources across nine layers:
- Properties and Boundaries for the lots and the outline, used in every layer.
- G-NAF Addresses.
- Planning Regulations for zoning, height limits, FSR and heritage.
- Amenities.
- Overture Buildings, Places, Infrastructure and Land Use.
The SQL
Nine statements, one per layer, and every one starts the same way: find Rosebery, take the lots inside it, and join them into one shape.
lots AS (
  SELECT p.geometry
  FROM core.properties p, rb
  WHERE p.geometry && ST_Envelope (rb.geometry)
    AND ST_Covers (rb.geometry, ST_PointOnSurface (p.geometry))
),
block AS (
  SELECT ST_UnaryUnion (ST_Collect (geometry)) AS geometry
  FROM lots
)
Everything else, from buildings to bus stops, is then tested against that one block.
Gaps and uncertainties
MapAI flagged seven, the most of any map so far:
- Strata records repeat their parent’s land value, so the $342.25 billion is a total of records, not a valuation.
- 1,968 of 2,049 buildings have no height.
- No floor areas or reliable storey counts, so FSR can’t be compared with what’s built.
- 65 infrastructure features that aren’t points were left out of the infrastructure layer.
- No railway station inside the block or within 25 m of its edge.
- No single zone, height limit or FSR applies to the whole area.
- The basemap can’t be set by a layer, so the styling suits a dark basemap rather than choosing one.
You can explore the live map here: 14 Power - Everything Map Rosebery.
What I noticed
The $342 billion problem
A suburb of 1.4 km² is not worth $342 billion. That would be about $244,000 for every square metre, including the roads.
The reason is in the first gap. Rosebery has 5,308 strata records, and in the property data each strata unit carries the land value of the whole lot it sits on. A block of 100 apartments on a $20 million lot shows up as 100 records of $20 million each, so summing them counts the same land 100 times.
What I like is that MapAI didn’t hide it. The number appears in the answer, because I asked for total land value, but the very first item in the gaps panel explains why it can’t be taken at face value. That is the Day 10 point in action: the headline is only as good as the trail behind it. The fix is a follow-up: count each parent lot’s land value once.
More doors than buildings
9,539 addresses, 7,485 lots, 2,049 buildings. That works out at about 4.7 addresses per building. Zoomed in, you can see why: along some streets there is one red address dot per house, while elsewhere the dots pile up inside a single orange footprint, an apartment block with dozens of front doors.
Nine buildings over the limit, maybe
Only 81 of 2,049 buildings, about 4%, have a height in the data. So “9 buildings taller than their limit” is 9 out of a small and probably unrepresentative sample. It’s interesting, but I wouldn’t put it in a report.
Addresses that know which suburb they’re in
One detail in the SQL is worth noting for tomorrow.
The address layer keeps only points labelled ROSEBERY and inside the block:
WHERE g.suburb = 'ROSEBERY'So any address that sits inside Rosebery but carries a neighbouring suburb’s name is quietly left out. Tomorrow’s map is about exactly those addresses.
Borges was right
The screenshot says it all. Nine layers, more than 20,000 features, every attribute in every tooltip, and the map is almost unreadable. It knows more than you’d ever need, and that is the problem.
A map of everything is an inventory, not a map. The value comes from choosing: which three layers answer the question you actually have. The good news is that once the inventory exists, asking the next, narrower question takes one sentence.
Day 14 done. Tomorrow: inside out.
#30DayMapChallenge #mapai #madewithmapai