Day 4 of the #30DayMapChallenge 2026.
Clusters — Clusters of something. Hotspots, groups, things that gather together.
On Day 1 I mapped every cafe in Greater Sydney. Today I went back to those cafes and asked a better question.
Clusters of cafes are a good stand-in for lively local high streets: the places you walk to for a coffee, a chat and a bit of street life. So instead of just finding the clusters, I asked MapAI: who in Sydney lives within a 10-minute walk of a cafe strip, and who doesn’t?
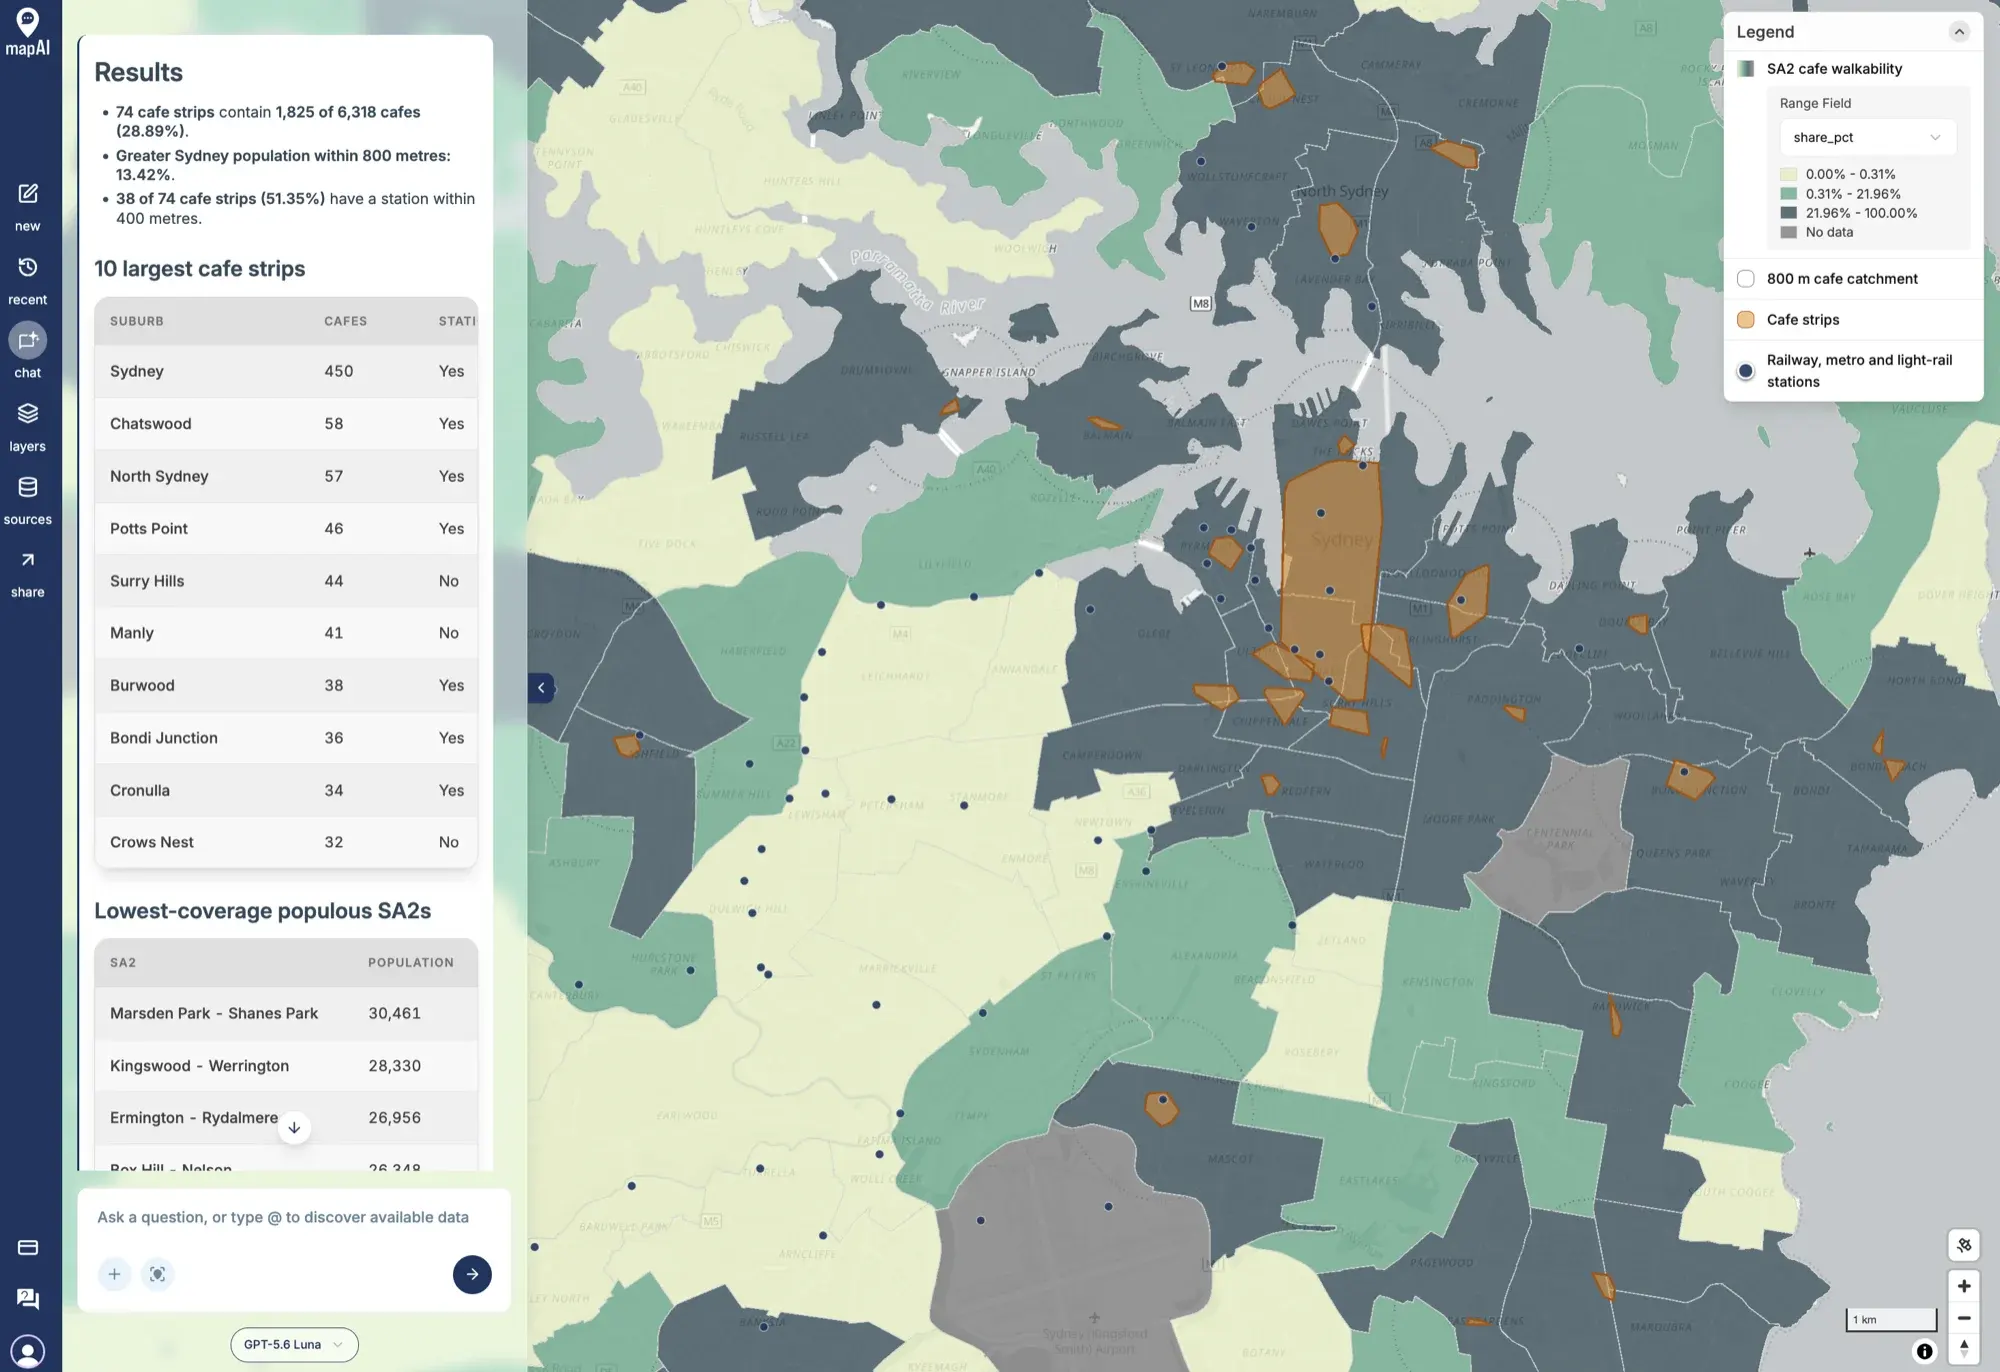
The prompt
This was the most ambitious prompt so far, pulling together the cafes from Day 1, the stations from Day 2 and the ABS population from Day 3:
Using Overture Places, fetch all cafes and coffee shops within Sydney (use GCCSA boundary).
Step 1 - Find cafe strips. Cluster the cafes using DBSCAN with a maximum distance of 150 metres and a minimum of 10 cafes per cluster, in a projected coordinate system in metres. Treat each cluster as a “cafe strip” and draw a convex hull around it. For each strip, record the number of cafes and the suburb containing most of them.
Step 2 - Walkable catchments. Buffer each cafe strip by 800 metres (roughly a 10-minute walk) and dissolve the buffers into a single catchment.
Step 3 - Who is served. Using the ABS Data API, fetch the 2025 estimated resident population (ERP) by SA2 for Greater Sydney with matching ASGS Edition 3 boundaries. For each SA2, estimate the share of its area inside the catchment and apply it to the population to estimate residents within walking distance of a cafe strip. Note this assumes population is spread evenly within each SA2.
Step 4 - Transit link. Using Overture, fetch the railway, metro and light-rail stations within Greater Sydney and work out how many cafe strips have a station within 400 metres.
Output 4 layers.
- SA2 polygons as a choropleth of the share of residents within walking distance of a cafe strip, light to dark, with thin light grey outlines. Grey out SA2s with fewer than 500 residents.
- The 800 m catchment as a light dotted outline with no fill.
- Cafe strips as hulls filled with semi-transparent orange and a darker orange outline.
- Stations as small dark blue circles.
Order the layers as listed, with the SA2s at the bottom. Configure tooltips for SA2s in this order: SA2 name, Population, Estimated residents within walking distance, % within walking distance. For cafe strips: Suburb, Number of cafes, Station within 400 m (yes/no).
In your answer, tell me:
- how many cafe strips were found and what share of all cafes are in one
- the 10 largest cafe strips with their suburb and cafe count
- the share of Greater Sydney’s population within 800 m of a cafe strip
- the 5 most populous SA2s with the lowest share of residents within walking distance
- the share of cafe strips with a station within 400 metres
- any parameters, assumptions and limitations you used
What MapAI found
- 74 cafe strips, containing 1,825 of Greater Sydney’s 6,318 cafes (28.89%).
- Only 13.42% of Greater Sydney’s population lives within 800 metres of a cafe strip.
- 38 of the 74 strips (51.35%) have a railway, metro or light-rail station within 400 metres.
The 10 largest cafe strips:
| Suburb | Cafes | Station within 400 m |
|---|---|---|
| Sydney | 450 | Yes |
| Chatswood | 58 | Yes |
| North Sydney | 57 | Yes |
| Potts Point | 46 | Yes |
| Surry Hills | 44 | No |
| Manly | 41 | No |
| Burwood | 38 | Yes |
| Bondi Junction | 36 | Yes |
| Cronulla | 34 | Yes |
| Crows Nest | 32 | No |
And the most populous SA2s with the lowest share of residents within walking distance of one:
| SA2 | Population |
|---|---|
| Marsden Park - Shanes Park | 30,461 |
| Kingswood - Werrington | 28,330 |
| Ermington - Rydalmere | 26,956 |
| Box Hill - Nelson | 26,348 |
What MapAI did
By the numbers, this map took:
- 41 tool calls
- About 11 minutes 40 seconds (700 seconds) from prompt to finished map
- About 256 credits
This was by far the longest run of the challenge so far, which makes sense for four datasets and four layers of analysis. Here is its evidence trail, in its own words where possible.
How it understood the question
- Source: Overture for the cafes and stations; the ABS for 2025 ERP and the ASGS Edition 3 boundaries.
- Measure: DBSCAN strips use 150 metres and a minimum of 10 cafes; each hull records its cafe count and dominant suburb.
- Geography: “Sydney” is the ASGS Edition 3 (2021) Greater Sydney GCCSA, with matching SA2 boundaries.
- Time: ERP uses the ABS annual 2025 observation.
- Thresholds: 800 metres for catchments, 400 metres for station links, and SA2s under 500 residents greyed out.
- Assumption: population is spread evenly within each SA2, so the share of an SA2’s area inside the catchment estimates the share of its residents served.
- Output: four layers, ordered SA2s, catchment, cafe-strip hulls, then stations.
The workflow
- Fetched Overture cafe and coffee shop features covering Greater Sydney.
- Kept the 6,318 cafes inside the GCCSA boundary.
- Clustered the cafes, applied the ten-cafe minimum, and kept 74 strips containing 1,825 cafes.
- Built convex hulls around the strips, buffered them by 800 metres and dissolved the buffers.
- Fetched 2025 ERP for 373 Greater Sydney SA2s using matching ASGS Edition 3 boundaries.
- Kept 242 stations stored as points and tested which strips have one within 400 metres.
- Saved the four layers in the requested order.
The data
- Overture Places for the cafes.
- Overture Infrastructure for the stations.
- ABS Data API for the 2025 ERP, the SA2 boundaries and the Greater Sydney boundary.
Gaps and uncertainties
MapAI flagged four:
- Overture’s category coverage and completeness decide which cafes are included.
- Straight-line buffers are not walking routes. They ignore streets, barriers like rivers and motorways, and hills.
- Stations stored as areas rather than points were left out of the station test, so that the station layer could be drawn as circles.
- Spreading population evenly across each SA2 is an area-based estimate, not a household-level measure.
You can explore the live map here: 04 Clusters - Cafe Clusters.
What I noticed
Sydney has thousands of cafes, but very few cafe strips. Fewer than three in ten cafes sit in a strip, and only about one in seven Sydneysiders lives within a 10-minute walk of one. Most of the city’s coffee is spread thin, one or two cafes at a time.
The CBD is one giant cluster of 450 cafes, almost a quarter of all the cafes in strips. That is DBSCAN doing what DBSCAN does: when cafes are packed this densely, every one is within 150 metres of another, and the whole city centre chains into a single cluster.
The lowest-coverage list is where it gets interesting. Marsden Park - Shanes Park and Box Hill - Nelson were two of the fastest-growing SA2s on Day 3. Tens of thousands of new residents, and no cafe strip within walking distance. The houses arrived first; the high streets have not caught up yet.
The station test is worth a second look too. Manly’s “No” is fair, because Manly is served by ferries, not trains. Crows Nest’s “No” is more suspicious, given it has had a metro station since 2024. It may be one of the stations stored as an area and left out of the test, exactly the gap MapAI flagged. A good reminder to read the evidence trail and not just the map.
Day 4 done. Tomorrow: Senses: Sight.
#30DayMapChallenge #mapai #madewithmapai